
Loose-leaf For Applied Statistics In Business And Economics
5th Edition
ISBN: 9781259328527
Author: David Doane, Lori Seward Senior Instructor of Operations Management
Publisher: McGraw-Hill Education
expand_more
expand_more
format_list_bulleted
Concept explainers
Videos
Textbook Question
Chapter 3, Problem 33CE
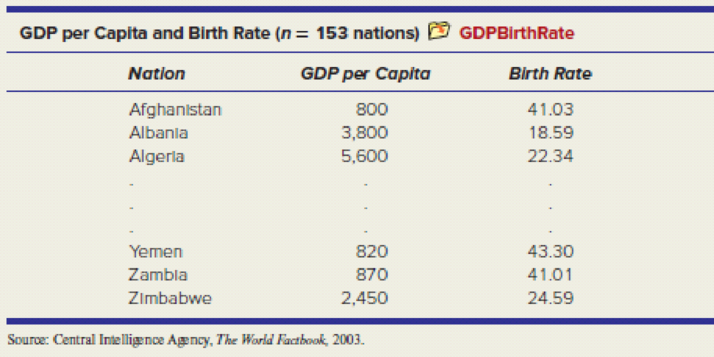
Download the full data set from the McGraw-Hill Connect® website (only six data values are shown). (a) Use Excel to make a
Expert Solution & Answer
Want to see the full answer?
Check out a sample textbook solution
Students have asked these similar questions
For unemployed persons in the United States, the average number of months of unemployment at the end of December 2009 was approximately seven months (Bureau of Labor Statistics, January 2010). Suppose the following data are for a particular region in upstate New York. The values in the first column show the number of
months unemployed and the values in the second column show the corresponding number of unemployed persons.
Months
Unemployed
Number
Unemployed
1
1029
2
1686
3
2269
4
2675
5
3487
6
4652
7
4145
8
3587
9
2325
10
1120
Let x be a random variable indicating the number of months a person is unemployed.
a. Use the data to develop an empirical discrete probability distribution for x (to 4 decimals).
(x)
f(x)
1
2
3
4
5
6
7
8
9
10
b. Show that your probability distribution satisfies the conditions for a valid discrete probability distribution.
The input in the box below will not be graded, but may be reviewed and considered by your instructor.
blank
c. What is the probability that a…
West Virginia has one of the highest divorce rates in the nation, with an annual rate of approximately 5 divorces per 1000 people (Centers for Disease Control and Prevention website, January 12, 2012). The Marital Counseling Center, Inc. (MCC) thinks that the high divorce rate in the state may require them to hire additional staff.
Working with a consultant, the management of MCC has developed the following probability distribution for x = the number of new clients for marriage counseling for the next year.
Excel File: data05-19.xls
x
10
f(x)
.05
20
30
.10
.10
40
.20
50
60
.35
.20
a. Is this probability distribution valid?
- Select your answer-
Explain.
f(x)
Σf(x)
Select your answer
Select your answer
b. What is the probability MCC will obtain more than 30 new clients (to 2 decimals)?
c. What is the probability MCC will obtain fewer than 20 new clients (to 2 decimals)?
d. Compute the expected value and variance of x.
Expected value
Variance
clients per year
squared clients per year
For unemployed persons in the United States, the average number of months of unemployment at the end of December 2009 was approximately seven months (Bureau of Labor Statistics, January 2010). Suppose the following data are for a particular region in upstate New York. The values in the first column show the number of
months unemployed and the values in the second column show the corresponding number of unemployed persons.
Months
Unemployed
Number
Unemployed
1
1029
2
1686
3
2269
4
2675
5
3487
6
4652
7
4145
8
3587
9
2325
10
1120
Let x be a random variable indicating the number of months a person is unemployed.
a. Use the data to develop an empirical discrete probability distribution for x (to 4 decimals).
(x)
f(x)
1
2
3
4
5
6
7
8
9
10
b. Show that your probability distribution satisfies the conditions for a valid discrete probability distribution.
The input in the box below will not be graded, but may be reviewed and considered by your instructor.
c. What is the probability that a person…
Chapter 3 Solutions
Loose-leaf For Applied Statistics In Business And Economics
Ch. 3.1 - (a) Make a stem-and-leaf plot for these 24...Ch. 3.1 - (a) Make a stem-and-leaf plot for the number of...Ch. 3.1 - Prob. 3SECh. 3.2 - (a) The table shows the number of days on the...Ch. 3.2 - (a) The table shows raw scores on a state civil...Ch. 3.2 - (a) Make a frequency distribution and histogram...Ch. 3.2 - (a) Make a frequency distribution and histogram...Ch. 3.2 - (a) Make a frequency distribution and histogram...Ch. 3.2 - For each frequency distribution, suggest nice...Ch. 3.2 - Below are sorted data showing average spending per...
Ch. 3.4 - (a) Use Excel to prepare a line chart to display...Ch. 3.4 - Prob. 12SECh. 3.4 - Prob. 13SECh. 3.4 - (a) Use Excel to prepare a line chart to display...Ch. 3.5 - Prob. 15SECh. 3.5 - Prob. 16SECh. 3.6 - (a) Use Excel to prepare a 2-D pie chart for these...Ch. 3.6 - Prob. 19SECh. 3.6 - Prob. 20SECh. 3.7 - (a) Use Excel to make a scatter plot of the data...Ch. 3.7 - Prob. 22SECh. 3.7 - Prob. 23SECh. 3.7 - (a) Use Excel to make a scatter plot of the data,...Ch. 3 - Name two attractive features and two limitations...Ch. 3 - (a) What is a frequency distribution? (b) What are...Ch. 3 - (a) What is a histogram? (b) What does it show?Ch. 3 - (a) What is a bimodal histogram? (b) Explain the...Ch. 3 - (a) What is a scatter plot? (b) What do scatter...Ch. 3 - For what kind of data would we use a bar chart?...Ch. 3 - For what kind of data would we use a line chart?...Ch. 3 - (a) List the three most common types of charts in...Ch. 3 - (a) For what kind of data would we use a pie...Ch. 3 - Which types of charts can be used for time series...Ch. 3 - (a) When might we need a log scale? (b) What do...Ch. 3 - When might we use a stacked column chart? An area...Ch. 3 - List five deceptive graphical techniques.Ch. 3 - What is a pivot table? Why is it useful?Ch. 3 - The durations (minutes) of 26 electric power...Ch. 3 - The U.S. Postal Service will ship a Priority Mail,...Ch. 3 - A study of 40 U.S. cardiac care centers showed the...Ch. 3 - Prob. 28CECh. 3 - Prob. 29CECh. 3 - Below are batting averages of the New York Yankees...Ch. 3 - Download the full data set of measurements of...Ch. 3 - Prob. 32CECh. 3 - Download the full data set from the McGraw-Hill...Ch. 3 - (a) What kind of display is this? (b) Identify its...Ch. 3 - (a) What kind of display is this? (b) Identify its...Ch. 3 - Prob. 36CECh. 3 - (a) What kind of display is this? (b) Identify its...Ch. 3 - Prob. 38CECh. 3 - (a) What kind of display is this? (b) Identify its...Ch. 3 - (a) What kind of display is this? (b) Identify its...Ch. 3 - Prob. 41CECh. 3 - Prob. 42CECh. 3 - (a) Use Excel to prepare an appropriate type of...Ch. 3 - Prob. 44CECh. 3 - Prob. 45CECh. 3 - (a) Use Excel to prepare an appropriate type of...Ch. 3 - Prob. 47CECh. 3 - (a) Use Excel to prepare an appropriate type of...
Knowledge Booster


Learn more about
Need a deep-dive on the concept behind this application? Look no further. Learn more about this topic, statistics and related others by exploring similar questions and additional content below.Similar questions
- In Gallup's Annual Consumption Habits Poll, telephone interviews were conducted for a random sample of 1014 adults aged 18 and over. One of the questions was "How many cups of coffee, if any, do you drink on an average day?" The following table shows the results obtained (Gallup website, August 6, 2012). Excel File: data05-23.xls Number of Cups per Day Number of Responses 0 365 264 193 3 4 or more 91 101 Define a random variable x = number of cups of coffee consumed on an average day. Let x = 4 represent four or more cups. Round your answers to four decimal places. a. Develop a probability distribution for x. x 0 1 2 3 4 f(x) b. Compute the expected value of x. cups of coffee c. Compute the variance of x. cups of coffee squared d. Suppose we are only interested in adults that drink at least one cup of coffee on an average day. For this group, let y = the number of cups of coffee consumed on an average day. Compute the expected value of y. Compare it to the expected value of x. The…arrow_forwardIn Gallup's Annual Consumption Habits Poll, telephone interviews were conducted for a random sample of 1014 adults aged 18 and over. One of the questions was "How many cups of coffee, if any, do you drink on an average day?" The following table shows the results obtained (Gallup website, August 6, 2012). Excel File: data05-23.xls Number of Cups per Day Number of Responses 0 365 264 193 2 3 4 or more 91 101 Define a random variable x = number of cups of coffee consumed on an average day. Let x = 4 represent four or more cups. Round your answers to four decimal places. a. Develop a probability distribution for x. x 0 1 2 3 f(x) b. Compute the expected value of x. cups of coffee c. Compute the variance of x. cups of coffee squared d. Suppose we are only interested in adults that drink at least one cup of coffee on an average day. For this group, let y = the number of cups of coffee consumed on an average day. Compute the expected value of y. Compare it to the expected value of x. The…arrow_forwardA technician services mailing machines at companies in the Phoenix area. Depending on the type of malfunction, the service call can take 1, 2, 3, or 4 hours. The different types of malfunctions occur at about the same frequency. Develop a probability distribution for the duration of a service call. Duration of Call x f(x) 1 2 3 4 Which of the following probability distribution graphs accurately represents the data set? Consider the required conditions for a discrete probability function, shown below.Does this probability distribution satisfy equation (5.1)?Does this probability distribution satisfy equation (5.2)? What is the probability a service call will take three hours? A service call has just come in, but the type of malfunction is unknown. It is 3:00 P.M. and service technicians usually get off at 5:00 P.M. What is the probability the service technician will have to work overtime to fix the machine today?arrow_forward
- A psychologist determined that the number of sessions required to obtain the trust of a new patient is either 1, 2, or 3. Let x be a random variable indicating the number of sessions required to gain the patient's trust. The following probability function has been proposed. x f(x) for x = 1, 2, or 3 a. Consider the required conditions for a discrete probability function, shown below. f(x) ≥0 Σf(x) = 1 (5.1) (5.2) Does this probability distribution satisfy equation (5.1)? Select Does this probability distribution satisfy equation (5.2)? Select b. What is the probability that it takes exactly 2 sessions to gain the patient's trust (to 3 decimals)? c. What is the probability that it takes at least 2 sessions to gain the patient's trust (to 3 decimals)?arrow_forwardA technician services mailing machines at companies in the Phoenix area. Depending on the type of malfunction, the service call can take 1, 2, 3, or 4 hours. The different types of malfunctions occur at about the same frequency. Develop a probability distribution for the duration of a service call. Which of the following probability distribution graphs accurately represents the data set? Consider the required conditions for a discrete probability function, shown below.Does this probability distribution satisfy equation (5.1)?Does this probability distribution satisfy equation (5.2)? What is the probability a service call will take three hours? A service call has just come in, but the type of malfunction is unknown. It is 3:00 P.M. and service technicians usually get off at 5:00 P.M. What is the probability the service technician will have to work overtime to fix the machine today?arrow_forwardWest Virginia has one of the highest divorce rates in the nation, with an annual rate of approximately 5 divorces per 1000 people (Centers for Disease Control and Prevention website, January 12, 2012). The Marital Counseling Center, Inc. (MCC) thinks that the high divorce rate in the state may require them to hire additional staff. Working with a consultant, the management of MCC has developed the following probability distribution for x = the number of new clients for marriage counseling for the next year. Excel File: data05-19.xls 10 20 f(x) .05 .10 11 30 40 50 60 .10 .20 .35 .20 a. Is this probability distribution valid? Yes Explain. greater than or equal to 0 f(x) Σf(x) equal to 1 b. What is the probability MCC will obtain more than 30 new clients (to 2 decimals)? c. What is the probability MCC will obtain fewer than 20 new clients (to 2 decimals)? d. Compute the expected value and variance of x. Expected value Variance clients per year squared clients per yeararrow_forward
- Reconsider the patient satisfaction data in Table 1. Fit a multiple regression model using both patient age and severity as the regressors. (a) Test for significance of regression. (b) Test for the individual contribution of the two regressors. Are both regressor variables needed in the model? (c) Has adding severity to the model improved the quality of the model fit? Explain your answer.arrow_forwardThe output voltage of a power supply is assumed to be normally distributed. Sixteen observations taken at random on voltage are as follows: 10.35, 9.30, 10.00, 9.96, 11.65, 12.00, 11.25, 9.58, 11.54, 9.95, 10.28, 8.37, 10.44, 9.25, 9.38, and 10.85. (a) Test the hypothesis that the mean voltage equals 12 V against a two-sided alternative using a = 0.05. (b) Construct a 95% two-sided confidence interval on μ. (c) Test the hypothesis that σ² = 11 using α = 0.05. (d) Construct a 95% two-sided confidence interval on σ. (e) Construct a 95% upper confidence interval on σ. (f) Does the assumption of normality seem reasonable for the output voltage?arrow_forwardAnalyze the residuals from the regression model on the patient satisfaction data from Exercise 3. Comment on the adequacy of the regression model.arrow_forward
- Consider the hypotheses: Hop=po H₁ppo where 2 is known. Derive a general expression for determining the sample size for detecting a true mean of 1μo with probability 1-ẞ if the type I error is a.arrow_forwardSuppose we wish to test the hypotheses: Họ : | = 15 H₁: 15 where we know that o² = 9.0. If the true mean is really 20, what sample size must be used to ensure that the probability of type II error is no greater than 0.10? Assume that a = 0.05.arrow_forwardTable 1 contains the data from a patient satisfaction survey for a group of 25 randomly selected patients at a hospital. In addition to satisfaction, data were collected on patient age and an index that measured the severity of illness. (a) Fit a linear regression model relating satisfaction to patient age. (b) Test for significance of regression. (c) What portion of the total variability is accounted for by the regressor variable age? Table 1: Patient Satisfaction Data Severity Observation Age (21) (x2) Satisfaction (y) 1 55 50 2 46 24 3 30 46 4 35 48 5 59 58 6 61 60 7 74 65 8 38 42 9 27 42 10 51 50 11 53 38 12 41 30 13 37 31 88 14 24 34 15 42 30 16 50 48 17 58 61 18 60 71 19 62 62 20 68 38 21 70 41 22 79 66 23 63 31 24 39 42 25 49 40 BE225222222222222222 68 77 96 80 43 44 26 88 75 57 56 88 102 88 70 43 46 56 59 26 83 75arrow_forward
arrow_back_ios
SEE MORE QUESTIONS
arrow_forward_ios
Recommended textbooks for you
 Glencoe Algebra 1, Student Edition, 9780079039897...AlgebraISBN:9780079039897Author:CarterPublisher:McGraw Hill
 Holt Mcdougal Larson Pre-algebra: Student Edition...AlgebraISBN:9780547587776Author:HOLT MCDOUGALPublisher:HOLT MCDOUGAL
 Big Ideas Math A Bridge To Success Algebra 1: Stu...AlgebraISBN:9781680331141Author:HOUGHTON MIFFLIN HARCOURTPublisher:Houghton Mifflin Harcourt
Glencoe Algebra 1, Student Edition, 9780079039897...
Algebra
ISBN:9780079039897
Author:Carter
Publisher:McGraw Hill
Holt Mcdougal Larson Pre-algebra: Student Edition...
Algebra
ISBN:9780547587776
Author:HOLT MCDOUGAL
Publisher:HOLT MCDOUGAL
Big Ideas Math A Bridge To Success Algebra 1: Stu...
Algebra
ISBN:9781680331141
Author:HOUGHTON MIFFLIN HARCOURT
Publisher:Houghton Mifflin Harcourt
Which is the best chart: Selecting among 14 types of charts Part II; Author: 365 Data Science;https://www.youtube.com/watch?v=qGaIB-bRn-A;License: Standard YouTube License, CC-BY