Students’ Ages Here are the ages of some students in a statistics class: 17, 19, 35, 18, 18, 20, 27, 25, 41, 21, 19, 19, 45, and 19. The teacher’s age is 66 and should be included as one of the ages when you do the calculations. The figure shows a histogram of the data. a. Describe the distribution of ages by giving the shape, the numerical value for an appropriate measure of the center, and the numerical value for an appropriate measure of spread, as well as mentioning any outliers. b. Make a rough sketch (or copy) of the histogram, and mark the approximate locations of the mean and of the median . Why are they not at the same location?
Students’ Ages Here are the ages of some students in a statistics class: 17, 19, 35, 18, 18, 20, 27, 25, 41, 21, 19, 19, 45, and 19. The teacher’s age is 66 and should be included as one of the ages when you do the calculations. The figure shows a histogram of the data. a. Describe the distribution of ages by giving the shape, the numerical value for an appropriate measure of the center, and the numerical value for an appropriate measure of spread, as well as mentioning any outliers. b. Make a rough sketch (or copy) of the histogram, and mark the approximate locations of the mean and of the median . Why are they not at the same location?
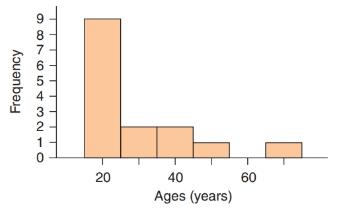
Students’ Ages Here are the ages of some students in a statistics class: 17, 19, 35, 18, 18, 20, 27, 25, 41, 21, 19, 19, 45, and 19. The teacher’s age is 66 and should be included as one of the ages when you do the calculations. The figure shows a histogram of the data.
a. Describe the distribution of ages by giving the shape, the numerical value for an appropriate measure of the center, and the numerical value for an appropriate measure of spread, as well as mentioning any outliers.
b. Make a rough sketch (or copy) of the histogram, and mark the approximate locations of the mean and of the median. Why are they not at the same location?
Statistics that help describe, summarize, and present information extracted from data. Descriptive statistics include concepts related to measures of central tendency, measures of variability, measures of frequency, shape of distribution, and some data visualization techniques/tools such as pivot tables, charts, and graphs.
Harvard University
California Institute of Technology
Massachusetts Institute of Technology
Stanford University
Princeton University
University of Cambridge
University of Oxford
University of California, Berkeley
Imperial College London
Yale University
University of California, Los Angeles
University of Chicago
Johns Hopkins University
Cornell University
ETH Zurich
University of Michigan
University of Toronto
Columbia University
University of Pennsylvania
Carnegie Mellon University
University of Hong Kong
University College London
University of Washington
Duke University
Northwestern University
University of Tokyo
Georgia Institute of Technology
Pohang University of Science and Technology
University of California, Santa Barbara
University of British Columbia
University of North Carolina at Chapel Hill
University of California, San Diego
University of Illinois at Urbana-Champaign
National University of Singapore
McGill…
Name
Harvard University
California Institute of Technology
Massachusetts Institute of Technology
Stanford University
Princeton University
University of Cambridge
University of Oxford
University of California, Berkeley
Imperial College London
Yale University
University of California, Los Angeles
University of Chicago
Johns Hopkins University
Cornell University
ETH Zurich
University of Michigan
University of Toronto
Columbia University
University of Pennsylvania
Carnegie Mellon University
University of Hong Kong
University College London
University of Washington
Duke University
Northwestern University
University of Tokyo
Georgia Institute of Technology
Pohang University of Science and Technology
University of California, Santa Barbara
University of British Columbia
University of North Carolina at Chapel Hill
University of California, San Diego
University of Illinois at Urbana-Champaign
National University of Singapore…
A company found that the daily sales revenue of its flagship product follows a normal distribution with a mean of $4500 and a standard deviation of $450. The company defines a "high-sales day" that is, any day with sales exceeding $4800. please provide a step by step on how to get the answers in excel
Q: What percentage of days can the company expect to have "high-sales days" or sales greater than $4800?
Q: What is the sales revenue threshold for the bottom 10% of days? (please note that 10% refers to the probability/area under bell curve towards the lower tail of bell curve)
Provide answers in the yellow cells
Need a deep-dive on the concept behind this application? Look no further. Learn more about this topic, statistics and related others by exploring similar questions and additional content below.


 Glencoe Algebra 1, Student Edition, 9780079039897...AlgebraISBN:9780079039897Author:CarterPublisher:McGraw Hill
 Holt Mcdougal Larson Pre-algebra: Student Edition...AlgebraISBN:9780547587776Author:HOLT MCDOUGALPublisher:HOLT MCDOUGAL
 Big Ideas Math A Bridge To Success Algebra 1: Stu...AlgebraISBN:9781680331141Author:HOUGHTON MIFFLIN HARCOURTPublisher:Houghton Mifflin Harcourt