Weight Loss (Example 3) The table shows Minitab descriptive statistics for the weight of some women (weight_f) and men (weight_m), and the self-reported ideal weights for both. a. Subtract the women's mean weight from their mean ideal weight to find the mean desired weight change. Did the women (as a group) tend to want to lose or to gain weight? How do you know? b. Subtract the men's mean weight from their mean ideal weight to find the mean desired weight change. Did the men (as a group) tend to want to lose or to gain weight? How do you know? c. On average, which group wanted the greatest weight change? Compare the mean desired weight loss for women and men. d. Which group's real weights had more variation as shown by the standard deviations (in the column headed StDev)?
Weight Loss (Example 3) The table shows Minitab descriptive statistics for the weight of some women (weight_f) and men (weight_m), and the self-reported ideal weights for both. a. Subtract the women's mean weight from their mean ideal weight to find the mean desired weight change. Did the women (as a group) tend to want to lose or to gain weight? How do you know? b. Subtract the men's mean weight from their mean ideal weight to find the mean desired weight change. Did the men (as a group) tend to want to lose or to gain weight? How do you know? c. On average, which group wanted the greatest weight change? Compare the mean desired weight loss for women and men. d. Which group's real weights had more variation as shown by the standard deviations (in the column headed StDev)?
Solution Summary: The author compares the mean weight change of women and men, and determines whether they gain or lose weight.
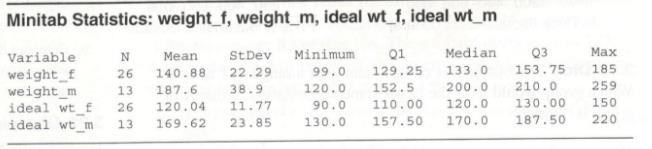
Weight Loss (Example 3) The table shows Minitab descriptive statistics for the weight of some women (weight_f) and men (weight_m), and the self-reported ideal weights for both.
a. Subtract the women's mean weight from their mean ideal weight to find the mean desired weight change. Did the women (as a group) tend to want to lose or to gain weight? How do you know?
b. Subtract the men's mean weight from their mean ideal weight to find the mean desired weight change. Did the men (as a group) tend to want to lose or to gain weight? How do you know?
c. On average, which group wanted the greatest weight change? Compare the mean desired weight loss for women and men.
d. Which group's real weights had more variation as shown by the standard deviations (in the column headed StDev)?
Statistics that help describe, summarize, and present information extracted from data. Descriptive statistics include concepts related to measures of central tendency, measures of variability, measures of frequency, shape of distribution, and some data visualization techniques/tools such as pivot tables, charts, and graphs.
NC Current Students - North Ce X | NC Canvas Login Links - North ( X
Final Exam Comprehensive x Cengage Learning
x
WASTAT - Final Exam - STAT
→
C
webassign.net/web/Student/Assignment-Responses/submit?dep=36055360&tags=autosave#question3659890_9
Part (b)
Draw a scatter plot of the ordered pairs.
N
Life
Expectancy
Life
Expectancy
80
70
600
50
40
30
20
10
Year of
1950
1970 1990
2010 Birth
O
Life
Expectancy
Part (c)
800
70
60
50
40
30
20
10
1950
1970 1990
W
ALT
林
$
#
4
R
J7
Year of
2010 Birth
F6
4+
80
70
60
50
40
30
20
10
Year of
1950 1970 1990
2010 Birth
Life
Expectancy
Ox
800
70
60
50
40
30
20
10
Year of
1950 1970 1990 2010 Birth
hp
P.B.
KA
&
7
80
% 5
H
A
B
F10
711
N
M
K
744
PRT SC
ALT
CTRL
Harvard University
California Institute of Technology
Massachusetts Institute of Technology
Stanford University
Princeton University
University of Cambridge
University of Oxford
University of California, Berkeley
Imperial College London
Yale University
University of California, Los Angeles
University of Chicago
Johns Hopkins University
Cornell University
ETH Zurich
University of Michigan
University of Toronto
Columbia University
University of Pennsylvania
Carnegie Mellon University
University of Hong Kong
University College London
University of Washington
Duke University
Northwestern University
University of Tokyo
Georgia Institute of Technology
Pohang University of Science and Technology
University of California, Santa Barbara
University of British Columbia
University of North Carolina at Chapel Hill
University of California, San Diego
University of Illinois at Urbana-Champaign
National University of Singapore
McGill…
Name
Harvard University
California Institute of Technology
Massachusetts Institute of Technology
Stanford University
Princeton University
University of Cambridge
University of Oxford
University of California, Berkeley
Imperial College London
Yale University
University of California, Los Angeles
University of Chicago
Johns Hopkins University
Cornell University
ETH Zurich
University of Michigan
University of Toronto
Columbia University
University of Pennsylvania
Carnegie Mellon University
University of Hong Kong
University College London
University of Washington
Duke University
Northwestern University
University of Tokyo
Georgia Institute of Technology
Pohang University of Science and Technology
University of California, Santa Barbara
University of British Columbia
University of North Carolina at Chapel Hill
University of California, San Diego
University of Illinois at Urbana-Champaign
National University of Singapore…
Need a deep-dive on the concept behind this application? Look no further. Learn more about this topic, statistics and related others by exploring similar questions and additional content below.


 Glencoe Algebra 1, Student Edition, 9780079039897...AlgebraISBN:9780079039897Author:CarterPublisher:McGraw Hill
 Holt Mcdougal Larson Pre-algebra: Student Edition...AlgebraISBN:9780547587776Author:HOLT MCDOUGALPublisher:HOLT MCDOUGAL
 Big Ideas Math A Bridge To Success Algebra 1: Stu...AlgebraISBN:9781680331141Author:HOUGHTON MIFFLIN HARCOURTPublisher:Houghton Mifflin Harcourt