
Ten Lessons in Introductory Sociology
2nd Edition
ISBN: 9780190663872
Author: Kenneth A. Gould; Tammy L. Lewis
Publisher: Oxford University Press Academic US
expand_more
expand_more
format_list_bulleted
Concept explainers
Videos
Textbook Question
Chapter 3, Problem 3SE
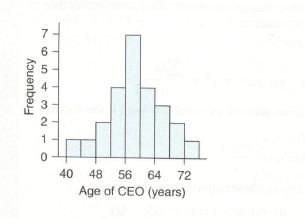
Age of CEOs (Example) the histogram shows the ages of 25 CEOs listed at Forbes.com. based on the distribution, what is the approximate
Expert Solution & Answer
Want to see the full answer?
Check out a sample textbook solution
Students have asked these similar questions
BUSINESS DISCUSS
A researcher wishes to estimate, with 90% confidence, the population proportion of adults who support labeling
legislation for genetically modified organisms (GMOs). Her estimate must be accurate within 4% of the true proportion.
(a) No preliminary estimate is available. Find the minimum sample size needed.
(b) Find the minimum sample size needed, using a prior study that found that 65% of the respondents said they support
labeling legislation for GMOs.
(c) Compare the results from parts (a) and (b).
...
(a) What is the minimum sample size needed assuming that no prior information is available?
n =
(Round up to the nearest whole number as needed.)
The table available below shows the costs per mile (in cents) for a sample of automobiles. At a = 0.05, can you conclude that at least one mean
cost per mile is different from the others?
Click on the icon to view the data table.
Let Hss, HMS, HLS, Hsuv and Hмy represent the mean costs per mile for small sedans, medium sedans, large sedans, SUV 4WDs, and minivans
respectively. What are the hypotheses for this test?
OA. Ho: Not all the means are equal.
Ha Hss HMS HLS HSUV HMV
B. Ho Hss HMS HLS HSUV = μMV
Ha: Hss *HMS *HLS*HSUV * HMV
C. Ho Hss HMS HLS HSUV =μMV
= =
H: Not all the means are equal.
D. Ho Hss HMS
HLS HSUV HMV
Ha Hss HMS
HLS =HSUV = HMV
Chapter 3 Solutions
Ten Lessons in Introductory Sociology
Ch. 3 - Earnings A sociologist says, “Typically, men in...Ch. 3 - Houses A real estate agent claims that all things...Ch. 3 - Age of CEOs (Example) the histogram shows the ages...Ch. 3 - Televisions The histogram shows the number of...Ch. 3 - Billionaires According to Forbes.com, the numbers...Ch. 3 - Billionaires According to Forbes.com, the numbers...Ch. 3 - Paid Vacation Days (Example 2) This list...Ch. 3 - Children of First Ladies This list represents the...Ch. 3 - Ages of Presidents at Inauguration At their...Ch. 3 - Ages of Chief Justices at Installation At their...
Ch. 3 - Weight Loss (Example 3) The table shows Minitab...Ch. 3 - Education of Father and Mother The table shows...Ch. 3 - Surfing College students and surfers Rex Robinson...Ch. 3 - Eating Out College student Jacqueline Loya asked a...Ch. 3 - Real state price (Example) look at the two...Ch. 3 - Dice The histogram contain data with a range of 1...Ch. 3 - Birth Weights (Example 5) The mean birth weigh for...Ch. 3 - Birth Length The mean birth length for U.S....Ch. 3 - Children’s Ages (Example 6) Mrs. Johnson’s...Ch. 3 - Pay Rate in Different Currencies The pay rates for...Ch. 3 - Olympics In the most recent summer Olympics, do...Ch. 3 - Weights Suppose you have a data set with the...Ch. 3 - Brain Size The brain size (in hundreds of...Ch. 3 - Happiness A survey on StatCrunch asked people to...Ch. 3 - Drinkers The number of alcoholic drinks per week...Ch. 3 - Prob. 26SECh. 3 - Violent Crime: West (Example 7) In 2011, the mean...Ch. 3 - Violent Crime: East In 2011, the mean rate of...Ch. 3 - Property Crime (Example 8) In 2011, the mean...Ch. 3 - Property Crime In 2011, the mean property crime...Ch. 3 - Heights and z-Scores The dotplot shows heights of...Ch. 3 - Heights Refer to the dotplot in the previous...Ch. 3 - Unusual IQs (Example 9) Wechsler IQ tests have a...Ch. 3 - Lengths of Pregnancy Distributions of gestation...Ch. 3 - Low-Birth-Weight Babies (Example 10) Babies born...Ch. 3 - Birth Lengths Babies born after 40 weeks gestation...Ch. 3 - Women's Heights Assume that women's heights have a...Ch. 3 - SATs The quantitative portion of the SAT exam has...Ch. 3 - Name two measures of the center of a distribution,...Ch. 3 - Name two measures of the variation of a...Ch. 3 - Pixar Animated Movies (Example 11) The ten...Ch. 3 - DreamWorks Animated Movies The ten top-grossing...Ch. 3 - Pixar Animated Movies Again (Example 12) Find the...Ch. 3 - Dreamworks Animated Movies Find the median and...Ch. 3 - Prob. 45SECh. 3 - Drinks The number of alcoholic drinks per week is...Ch. 3 - Outliers a. In your own words, describe to someone...Ch. 3 - Center and Variation When you are comparing two...Ch. 3 - An Error A dieter recorded the number of calories...Ch. 3 - Baseball Strike In 1994, Major League Baseball...Ch. 3 - Heads The graphs show the circumferences of heads...Ch. 3 - House Prices The graphs show the house prices (in...Ch. 3 - Shoes (Example 14) The histograms show the number...Ch. 3 - Tax Rate A StatCrunch survey asked people what...Ch. 3 - Regional Population Density The figure shows the...Ch. 3 - Property Crime Rates The boxplot shows the...Ch. 3 - City Temperatures The boxplot shows temperatures...Ch. 3 - Brain Size The boxplots show the brain size (in...Ch. 3 - Matching Boxplots and Histograms a. Report the...Ch. 3 - Matching Boxplots and Histograms Match each of the...Ch. 3 - Sleep Time of Animals Data at this text's website...Ch. 3 - BA Percentage The data show the percentage of...Ch. 3 - Tall Buildings The dotplot shows the distribution...Ch. 3 - Passing the Bar Exam The dotplot shows the...Ch. 3 - Exam Scores The five-number summary for a...Ch. 3 - Exam Scores The five-number summary for a...Ch. 3 - Death Row: South (Example 15) The table shows the...Ch. 3 - Death Row: West The table shows the numbers of...Ch. 3 - Head Circumference (Example 16) Following are head...Ch. 3 - Heights of Sons and Dads The data at this text’s...Ch. 3 - Final Exam Grades The data that follow are final...Ch. 3 - Speeding Tickets College students Diane Glover and...Ch. 3 - Heights The following graph shows the heights for...Ch. 3 - Marathon Times The following histogram of marathon...Ch. 3 - Soda Consumption A StatCrunch survey asked people...Ch. 3 - Holiday Spending A StatCrunch survey asked people...Ch. 3 - a. State an approximate value for the mean height...Ch. 3 - Ideal Family In 2012, the General Social Survey...Ch. 3 - For exercises 3.85 through 3.88, construct two...Ch. 3 - For exercises 3.85 through 3.88, construct two...Ch. 3 - For exercises 3.85 through 3.88, construct two...Ch. 3 - 3.79-3.82 construct two sets of numbers with at...Ch. 3 - Population Density Data were recorded for each of...Ch. 3 - Population Increase Data were recorded for each of...Ch. 3 - Prob. 85CRECh. 3 - Eating Out, Again College student Jacqueline Loya...Ch. 3 - Study Hours A group of 50 statistics students, 25...Ch. 3 - Driving Accidents College student Sandy Hudson...Ch. 3 - Exam Scores An exam has a mean of 70 and a...Ch. 3 - Boys’ Heights Three-year-old boys in the United...Ch. 3 - SAT and ACT Scores Quantitative SAT scores have a...Ch. 3 - Children’s Heights Mrs. Diaz has two children: a...Ch. 3 - Students’ Ages Here are the ages of some students...Ch. 3 - House Prices The figure, which is from data taken...
Knowledge Booster


Learn more about
Need a deep-dive on the concept behind this application? Look no further. Learn more about this topic, statistics and related others by exploring similar questions and additional content below.Similar questions
- Question: A company launches two different marketing campaigns to promote the same product in two different regions. After one month, the company collects the sales data (in units sold) from both regions to compare the effectiveness of the campaigns. The company wants to determine whether there is a significant difference in the mean sales between the two regions. Perform a two sample T-test You can provide your answer by inserting a text box and the answer must include: Null hypothesis, Alternative hypothesis, Show answer (output table/summary table), and Conclusion based on the P value. (2 points = 0.5 x 4 Answers) Each of these is worth 0.5 points. However, showing the calculation is must. If calculation is missing, the whole answer won't get any credit.arrow_forwardBinomial Prob. Question: A new teaching method claims to improve student engagement. A survey reveals that 60% of students find this method engaging. If 15 students are randomly selected, what is the probability that: a) Exactly 9 students find the method engaging?b) At least 7 students find the method engaging? (2 points = 1 x 2 answers) Provide answers in the yellow cellsarrow_forwardIn a survey of 2273 adults, 739 say they believe in UFOS. Construct a 95% confidence interval for the population proportion of adults who believe in UFOs. A 95% confidence interval for the population proportion is ( ☐, ☐ ). (Round to three decimal places as needed.)arrow_forward
- Find the minimum sample size n needed to estimate μ for the given values of c, σ, and E. C=0.98, σ 6.7, and E = 2 Assume that a preliminary sample has at least 30 members. n = (Round up to the nearest whole number.)arrow_forwardIn a survey of 2193 adults in a recent year, 1233 say they have made a New Year's resolution. Construct 90% and 95% confidence intervals for the population proportion. Interpret the results and compare the widths of the confidence intervals. The 90% confidence interval for the population proportion p is (Round to three decimal places as needed.) J.D) .arrow_forwardLet p be the population proportion for the following condition. Find the point estimates for p and q. In a survey of 1143 adults from country A, 317 said that they were not confident that the food they eat in country A is safe. The point estimate for p, p, is (Round to three decimal places as needed.) ...arrow_forward
- (c) Because logistic regression predicts probabilities of outcomes, observations used to build a logistic regression model need not be independent. A. false: all observations must be independent B. true C. false: only observations with the same outcome need to be independent I ANSWERED: A. false: all observations must be independent. (This was marked wrong but I have no idea why. Isn't this a basic assumption of logistic regression)arrow_forwardBusiness discussarrow_forwardSpam filters are built on principles similar to those used in logistic regression. We fit a probability that each message is spam or not spam. We have several variables for each email. Here are a few: to_multiple=1 if there are multiple recipients, winner=1 if the word 'winner' appears in the subject line, format=1 if the email is poorly formatted, re_subj=1 if "re" appears in the subject line. A logistic model was fit to a dataset with the following output: Estimate SE Z Pr(>|Z|) (Intercept) -0.8161 0.086 -9.4895 0 to_multiple -2.5651 0.3052 -8.4047 0 winner 1.5801 0.3156 5.0067 0 format -0.1528 0.1136 -1.3451 0.1786 re_subj -2.8401 0.363 -7.824 0 (a) Write down the model using the coefficients from the model fit.log_odds(spam) = -0.8161 + -2.5651 + to_multiple + 1.5801 winner + -0.1528 format + -2.8401 re_subj(b) Suppose we have an observation where to_multiple=0, winner=1, format=0, and re_subj=0. What is the predicted probability that this message is spam?…arrow_forward
- Consider an event X comprised of three outcomes whose probabilities are 9/18, 1/18,and 6/18. Compute the probability of the complement of the event. Question content area bottom Part 1 A.1/2 B.2/18 C.16/18 D.16/3arrow_forwardJohn and Mike were offered mints. What is the probability that at least John or Mike would respond favorably? (Hint: Use the classical definition.) Question content area bottom Part 1 A.1/2 B.3/4 C.1/8 D.3/8arrow_forwardThe details of the clock sales at a supermarket for the past 6 weeks are shown in the table below. The time series appears to be relatively stable, without trend, seasonal, or cyclical effects. The simple moving average value of k is set at 2. What is the simple moving average root mean square error? Round to two decimal places. Week Units sold 1 88 2 44 3 54 4 65 5 72 6 85 Question content area bottom Part 1 A. 207.13 B. 20.12 C. 14.39 D. 0.21arrow_forward
arrow_back_ios
SEE MORE QUESTIONS
arrow_forward_ios
Recommended textbooks for you
 Glencoe Algebra 1, Student Edition, 9780079039897...AlgebraISBN:9780079039897Author:CarterPublisher:McGraw Hill
 Holt Mcdougal Larson Pre-algebra: Student Edition...AlgebraISBN:9780547587776Author:HOLT MCDOUGALPublisher:HOLT MCDOUGAL
 Big Ideas Math A Bridge To Success Algebra 1: Stu...AlgebraISBN:9781680331141Author:HOUGHTON MIFFLIN HARCOURTPublisher:Houghton Mifflin Harcourt
Glencoe Algebra 1, Student Edition, 9780079039897...
Algebra
ISBN:9780079039897
Author:Carter
Publisher:McGraw Hill
Holt Mcdougal Larson Pre-algebra: Student Edition...
Algebra
ISBN:9780547587776
Author:HOLT MCDOUGAL
Publisher:HOLT MCDOUGAL
Big Ideas Math A Bridge To Success Algebra 1: Stu...
Algebra
ISBN:9781680331141
Author:HOUGHTON MIFFLIN HARCOURT
Publisher:Houghton Mifflin Harcourt
The Shape of Data: Distributions: Crash Course Statistics #7; Author: CrashCourse;https://www.youtube.com/watch?v=bPFNxD3Yg6U;License: Standard YouTube License, CC-BY
Shape, Center, and Spread - Module 20.2 (Part 1); Author: Mrmathblog;https://www.youtube.com/watch?v=COaid7O_Gag;License: Standard YouTube License, CC-BY
Shape, Center and Spread; Author: Emily Murdock;https://www.youtube.com/watch?v=_YyW0DSCzpM;License: Standard Youtube License