
MICROECONOMICS IN MODULES
5th Edition
ISBN: 9781319245382
Author: KRUGMAN
Publisher: MAC HIGHER
expand_more
expand_more
format_list_bulleted
Question
Chapter 3, Problem 8P
To determine
To Explanation:
The following questions associated with table given.
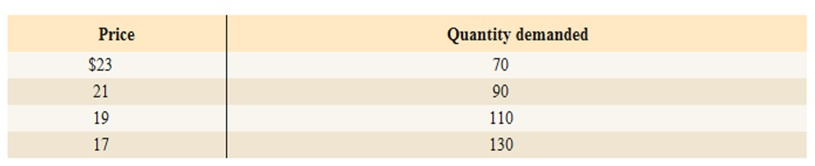
- Do you think the increase in quantity demanded (say, from 90 to 110 in the table) when price decreases (from $21 to $19) is due to a rise in consumer’s income? Explain clearly (and briefly) why or why not.
- Now suppose that the good is an inferior good. Would the demand schedule still be valid for an inferior good?
- Lastly, assume you do not know whether the good is normal or inferior. Devise an experiment that would allow you to determine which one it was. Explain.
Concept Introduction:
Normal Goods: Normal goods are those goods which have a direct relationship between the income and quantity demanded. When income increases the quantity demanded also increases and vice versa.
Inferior goods: The inferior goods are those kinds of goods it demanded decreases when the income of the people increases for e.g. Potatoes
Demand: The demand is defined as the ability to pay for goods and services.
Expert Solution & Answer
Want to see the full answer?
Check out a sample textbook solution
Students have asked these similar questions
Don't use ai to answer I will report you answer
The figure to the right shows the economy initially in equilibrium at output
Upper Y 0Y0.
Suppose that the price level in the economy increases.
Using the line drawing tool, show the impact this increase has on the AE curve. Properly label this line
AE Subscript 1.
Note: Carefully follow the instructions above and only draw the required object.
According to your graph, the relationship between the price level and the level of aggregate output (income) is (indeterminate, positive, negative) --> pick one answer.picture is attached.
Use graph A on the right to determine what happens to the equilibrium values of the interest rate and output when there is
an increasean increase
in government spending (G) with the Fed changing the money supply
(M Superscript S)
by enough to keepby enough to keep
interest rates constantinterest rates constant.
1.) Using the 3-point curved line drawing tool, illustrate the impact of the
increaseincrease
in G. Properly label your curve.
2.) Using the line drawing tool, illustrate the impact of the Fed's money supply decision. Properly label your curve.
3.) Using the point drawing tool, identify the economy's new equilibrium point.
Use graph B on the right to determine what happens to the equilibrium values of the interest rate and output when there is
anan
increaseincrease
in
Upper GG
with no change in
the money supplythe money supply.
1.) Using either the 3-point curved line drawing tool to shift the IS curve or using the line drawing tool to shift the Fed rule…
Chapter 3 Solutions
MICROECONOMICS IN MODULES
Ch. 3 - Prob. aWYWLCh. 3 - Prob. bWYWLCh. 3 - Prob. cWYWLCh. 3 - Prob. dWYWLCh. 3 - Prob. 1QFTCh. 3 - Prob. 2QFTCh. 3 - Prob. 3QFTCh. 3 - Prob. 1PCh. 3 - Prob. 2PCh. 3 - Prob. 3P
Ch. 3 - Prob. 4PCh. 3 - Prob. 5PCh. 3 - Prob. 6PCh. 3 - Prob. 7PCh. 3 - Prob. 8PCh. 3 - Prob. 9PCh. 3 - Prob. 10PCh. 3 - Prob. 11PCh. 3 - Prob. 12PCh. 3 - Prob. 13PCh. 3 - Prob. 14PCh. 3 - Prob. 15PCh. 3 - Prob. 16PCh. 3 - Prob. 17PCh. 3 - Prob. 18PCh. 3 - Prob. 19PCh. 3 - Prob. 20PCh. 3 - Prob. 21P
Knowledge Booster

Similar questions
- Some economists argue that the "animal spirits" of investors are so important in determining the level of investment in the economy that interest rates do not matter at all. Part 2 a. Suppose that this were truelong dash—that investment in no way depends on interest rates. Using the line drawing tool, show what the investment curve would look like. Label the line 'I'. is my answer correct?arrow_forwardProblem 3 ABC Challenges: Attrition, Balance and Compliance Can television inform people about public affairs? Political scientists Bethany Albertson and Adria Lawrence (2009) conducted an experiment in which they randomly assigned people to treatment and control groups to evaluate the effect of watching TV on a person's information level. Those assigned to the treatment group were told to watch a specific television broadcast and were later asked questions related to what they watched. Those in the control group were not shown the TV broadcast but were asked questions related to the material in the TV broadcast. The dataset contains the following variables: • • • • • • Read News: Dummy variable which =1 if a person reads news and 0 otherwise. Political Interest: interest in political affairs (not interested=1 to very interested=4) Education: years of education Female: female dummy variable (female=1; male=0) Income: family income in thousands of dollars Information Level: information…arrow_forwardThe figure to the right gives an economy's initial aggregate demand (AD) curve. Using the line drawing tool, show an increase in aggregate demand. Properly label this line. Part 2 Note: Carefully follow the instructions above and only draw the required object. Part 3 Which of the following will generate an increase in aggregate demand? A. A decrease in the price level. B. A decrease in the money supply. C. Increased government expenditures for war. D. A tax increase.arrow_forward
- Problem 2 Experiments/Randomized Control Trial Suppose you are interested in studying the effect of academic counselling on the years it takes for a student to obtain an undergraduate degree. You conduct a randomized control trial to answer the question. You randomly assign 2500 individuals in a university in New York to receive academic counselling and 2500 students to not receive any academic counselling. a. Which people are a part of the treatment group and which people are a part of the control group? (5 points) b. What regression will you run? Define the variables where required. (5 points) Λ c. Suppose you estimate ß₁ = -0.3. Interpret it. (5 points) 1 d. You test for balance using the variables mentioned in the table below. Based on the results do you think that the treatment and control group are balanced? If your answer is "yes" then explain why. If your answer is "no", then explain why and mention how will you address the issue of imbalance. (10 points) Variable GPA Average…arrow_forwardProblem 1 Experiments/Randomized Control Trial Suppose you are interested in studying the effect of being a part of the labor union on an individual's hourly wage. You collect data on 1000 people and run the following regression. Wage=Bo+B₁Labor Union; + &¿ where Labor Union is a dummy variable which is equal t to 1 for people who are a part of labor union and 0 for others. a. Suppose you estimate b. Do you think B₁ = 1.6. Interpret B₁ (5 points) 1 1 is biased or unbiased? Explain. (5 points) Now suppose you conduct a randomized control trial to answer the same question. You randomly assign some individuals to be a part of the labor union and others to not be a part of the labor union. The first step you take is to ensure that the randomization was done correctly. Then you estimate the following equation: = Wage, Bo+B₁Treatment; + &; Treatment =1 if the student is assigned to be a part of Labor Union Treatment=0 if the student is assigned to not be a part of Labor Union c. Why is it…arrow_forwardThe figure to the right contains a point indicating the economy's initial price and aggregate output (Upper P 0P0,Upper Y 0Y0) combination. Suppose that the price level rises such that P Subscript 1 > P Subscript 0. Using the point drawing tool, identify a potential location for the economy's new price and aggregate output (Upper P 1P1,Upper Y 1Y1) combination. Label this point B. Using the line drawing tool, draw the aggregate demand curve through these points. Properly label the line. picture is attachedarrow_forward
- Question content area left Part 1 The figure to the right gives an economy's initial aggregate demand (AD) curve. Using the line drawing tool, show a decrease in aggregate demand. Properly label this line. Part 2 Note: Carefully follow the instructions above and only draw the required object. Part 3 Which of the following will generate a decrease in aggregate demand? A. Increased government expenditures for infrastructure. B. A tax increase. C. An increase in the price level. D. An increase in the money supply.arrow_forwardA movie theater is showing two different movies: a Hollywood blockbuster (with 100 customers willing to pay $10 for a ticket, and 100 willing to pay $8) and an independent film that attracts 50 film buffs, willing to pay $20 each. Marginal costs are zero and neither movie can fill theater capacity. What is the theater's maximum profit if it cannot price discriminate (it must charge the same price for both movies) and if it can price discriminate (it may charge different prices for different movies)? a. $2,000; $2,600 b. $1,500; $2,100 c. $1,500; $2,000arrow_forwardA movie theater is showing two different movies: a Hollywood blockbuster (with 100 customers willing to pay $10 for a ticket, and 100 willing to pay $8) and an independent film that attracts 50 film buffs, willing to pay $20 each. Marginal costs are zero and neither movie can fill theater capacity. What is the theater's maximum profit if it cannot price discriminate (it must charge the same price for both movies) and if it can price discriminate (it may charge different prices for different movies)? a. $2,000; $2,600 b. $1,500; $2,100 c. $1,500; $2,000arrow_forward
- What profi is most important in business ?arrow_forward5. Download the Excel sheet from Brightspace. The data contains the GDP per capita and GNI per capita of OECD member countries in 2014 (both figures are reported in US dollars). The countries are ranked by GDP per capita. a. Compute the ratio of GNI to GDP for each country (GNI per capita/GDP per capita). What does this imply about net factor income from abroad for each country? b. Rank the countries based on the GNI/GDP ratio, starting with the country with the highest ratio and ending with the country with the lowest ratio. Which country has the highest ratio, and which has the lowest? c. Comment on why the countries you identified in the previous question have a large difference between GDP and GNI? What does the difference imply?arrow_forward3. Answer the following questions about external wealth. a. Home has external wealth of $100 million in period t. In t+1, Home purchases $160 million foreign assets, and Foreign purchases $120 million in Home assets. Assume a world interest rate of 10% per annum. Compute the "change" in external wealth at t+1 for Home. b. A country's external wealth was -$1.5 billion at the end of 2015, and its trade balance was $750 million in 2016. Assume the world interest rate is 5% per annum. What is the "value" of a country's external wealth at the end of 2016?arrow_forward
arrow_back_ios
SEE MORE QUESTIONS
arrow_forward_ios
Recommended textbooks for you

 Principles of Economics (12th Edition)EconomicsISBN:9780134078779Author:Karl E. Case, Ray C. Fair, Sharon E. OsterPublisher:PEARSON
 Engineering Economy (17th Edition)EconomicsISBN:9780134870069Author:William G. Sullivan, Elin M. Wicks, C. Patrick KoellingPublisher:PEARSON
 Principles of Economics (MindTap Course List)EconomicsISBN:9781305585126Author:N. Gregory MankiwPublisher:Cengage Learning
 Managerial Economics: A Problem Solving ApproachEconomicsISBN:9781337106665Author:Luke M. Froeb, Brian T. McCann, Michael R. Ward, Mike ShorPublisher:Cengage Learning
 Managerial Economics & Business Strategy (Mcgraw-...EconomicsISBN:9781259290619Author:Michael Baye, Jeff PrincePublisher:McGraw-Hill Education
Principles of Economics (12th Edition)
Economics
ISBN:9780134078779
Author:Karl E. Case, Ray C. Fair, Sharon E. Oster
Publisher:PEARSON
Engineering Economy (17th Edition)
Economics
ISBN:9780134870069
Author:William G. Sullivan, Elin M. Wicks, C. Patrick Koelling
Publisher:PEARSON
Principles of Economics (MindTap Course List)
Economics
ISBN:9781305585126
Author:N. Gregory Mankiw
Publisher:Cengage Learning
Managerial Economics: A Problem Solving Approach
Economics
ISBN:9781337106665
Author:Luke M. Froeb, Brian T. McCann, Michael R. Ward, Mike Shor
Publisher:Cengage Learning
Managerial Economics & Business Strategy (Mcgraw-...
Economics
ISBN:9781259290619
Author:Michael Baye, Jeff Prince
Publisher:McGraw-Hill Education