
Videos
Open P2WORK4 and click the Chart sheet tab. On the screen, a pie chart shows the percentage composition of the total expenses of Sports Connection. Enter the percentages in the spaces provided.
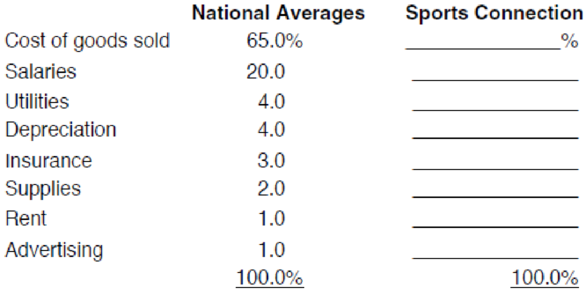
Compare the percentages of Sports Connection with the national statistics provided. Comment on the differences noted. Why might
TICKLERS (optional)
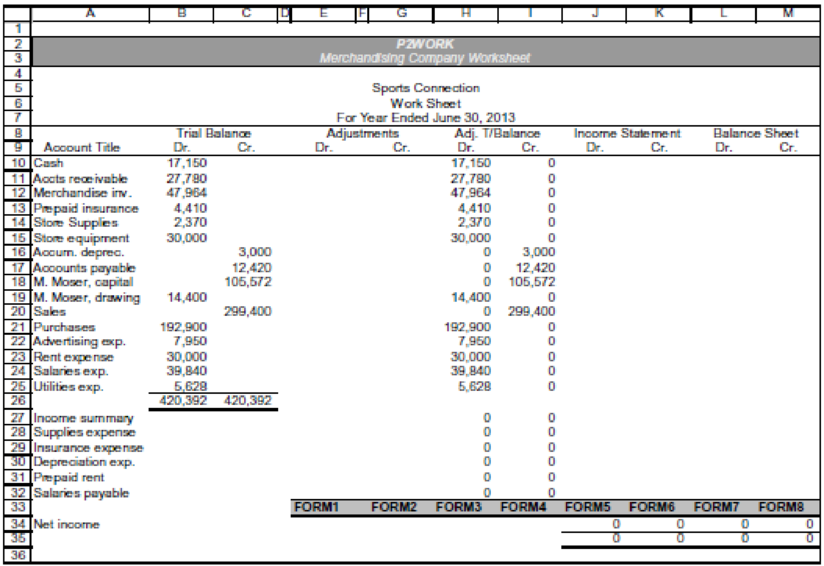
Worksheet. You prepared a
Chart. Using the P2WORK4 file, create a column chart showing the dollar total of each of the expenses (except Cost of goods sold) of Sports Connection. Use the Chart Data Table as a basis for preparing the chart. Use appropriate titles, legends, and formats. Enter your name somewhere on the chart. Save the file again as P2WORK4. Select the chart and then print it out.
Want to see the full answer?
Check out a sample textbook solution
Chapter 3 Solutions
Excel Applications for Accounting Principles


 Excel Applications for Accounting PrinciplesAccountingISBN:9781111581565Author:Gaylord N. SmithPublisher:Cengage Learning