Senator Years in Office (Example 14) The following histograms show the number of years in office for Democratic and Republican U.S. senators. (Source: Infogalactic.com) a. Describe the shape of each histogram. b. Because of the shapes, what measures of center should be compared: the means or the medians ? c. Because of the shapes, what measures of spread should be compared: the standard deviations or the interquartile ranges ? d. Use the appropriate measures to compare the distributions of years in office for the two political parties. Descriptive Statistics : Years in Office Statistics
Senator Years in Office (Example 14) The following histograms show the number of years in office for Democratic and Republican U.S. senators. (Source: Infogalactic.com) a. Describe the shape of each histogram. b. Because of the shapes, what measures of center should be compared: the means or the medians ? c. Because of the shapes, what measures of spread should be compared: the standard deviations or the interquartile ranges ? d. Use the appropriate measures to compare the distributions of years in office for the two political parties. Descriptive Statistics : Years in Office Statistics
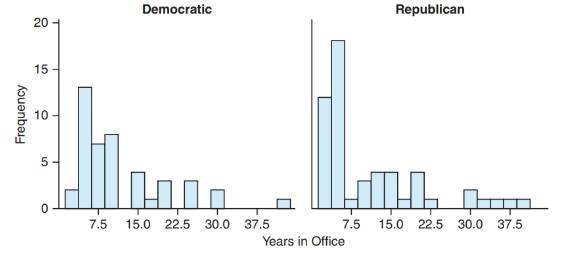
Senator Years in Office (Example 14) The following histograms show the number of years in office for Democratic and Republican U.S. senators. (Source: Infogalactic.com)
a. Describe the shape of each histogram.
b. Because of the shapes, what measures of center should be compared: the means or the medians?
c. Because of the shapes, what measures of spread should be compared: the standard deviations or the interquartile ranges?
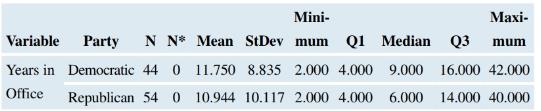
d. Use the appropriate measures to compare the distributions of years in office for the two political parties.
Descriptive Statistics: Years in Office
Statistics
Statistics that help describe, summarize, and present information extracted from data. Descriptive statistics include concepts related to measures of central tendency, measures of variability, measures of frequency, shape of distribution, and some data visualization techniques/tools such as pivot tables, charts, and graphs.
Find the critical value for a left-tailed test using the F distribution with a 0.025, degrees of freedom in the numerator=12, and degrees of freedom in the
denominator = 50. A portion of the table of critical values of the F-distribution is provided.
Click the icon to view the partial table of critical values of the F-distribution.
What is the critical value?
(Round to two decimal places as needed.)
A retail store manager claims that the average daily sales of the store are $1,500.
You aim to test whether the actual average daily sales differ significantly from this claimed value.
You can provide your answer by inserting a text box and the answer must include:
Null hypothesis,
Alternative hypothesis,
Show answer (output table/summary table), and
Conclusion based on the P value.
Showing the calculation is a must. If calculation is missing,so please provide a step by step on the answers
Numerical answers in the yellow cells
Need a deep-dive on the concept behind this application? Look no further. Learn more about this topic, statistics and related others by exploring similar questions and additional content below.


 Big Ideas Math A Bridge To Success Algebra 1: Stu...AlgebraISBN:9781680331141Author:HOUGHTON MIFFLIN HARCOURTPublisher:Houghton Mifflin Harcourt
 Glencoe Algebra 1, Student Edition, 9780079039897...AlgebraISBN:9780079039897Author:CarterPublisher:McGraw Hill
 Holt Mcdougal Larson Pre-algebra: Student Edition...AlgebraISBN:9780547587776Author:HOLT MCDOUGALPublisher:HOLT MCDOUGAL