Home Prices (FL and GA) The prices (in $ thousand) of a sample of three-bedroom homes for sale in Florida and Georgia are shown in the table. (Source: Zillow.com) a. In which state are homes typically more expensive? Support your answer using an appropriate statistic. b. Which state has more variation in home prices? Support your answer using an appropriate statistic. c. Notice that one home price in the Florida data ( $ 432.4 thousand) seems unusually high when compared with the other home prices. What would happen to the standard deviation if this home price was removed from the data? Calculate the standard deviation, omitting this value from the data. Was your prediction correct?
Home Prices (FL and GA) The prices (in $ thousand) of a sample of three-bedroom homes for sale in Florida and Georgia are shown in the table. (Source: Zillow.com) a. In which state are homes typically more expensive? Support your answer using an appropriate statistic. b. Which state has more variation in home prices? Support your answer using an appropriate statistic. c. Notice that one home price in the Florida data ( $ 432.4 thousand) seems unusually high when compared with the other home prices. What would happen to the standard deviation if this home price was removed from the data? Calculate the standard deviation, omitting this value from the data. Was your prediction correct?
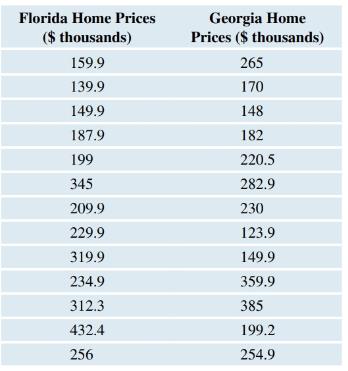
Home Prices (FL and GA) The prices (in
$
thousand) of a sample of three-bedroom homes for sale in Florida and Georgia are shown in the table. (Source: Zillow.com)
a. In which state are homes typically more expensive? Support your answer using an appropriate statistic.
b. Which state has more variation in home prices? Support your answer using an appropriate statistic.
c. Notice that one home price in the Florida data (
$
432.4
thousand) seems unusually high when compared with the other home prices. What would happen to the standard deviation if this home price was removed from the data? Calculate the standard deviation, omitting this value from the data. Was your prediction correct?
A retail store manager claims that the average daily sales of the store are $1,500.
You aim to test whether the actual average daily sales differ significantly from this claimed value.
You can provide your answer by inserting a text box and the answer must include:
Null hypothesis,
Alternative hypothesis,
Show answer (output table/summary table), and
Conclusion based on the P value.
Showing the calculation is a must. If calculation is missing,so please provide a step by step on the answers
Numerical answers in the yellow cells
Need a deep-dive on the concept behind this application? Look no further. Learn more about this topic, statistics and related others by exploring similar questions and additional content below.


 Big Ideas Math A Bridge To Success Algebra 1: Stu...AlgebraISBN:9781680331141Author:HOUGHTON MIFFLIN HARCOURTPublisher:Houghton Mifflin Harcourt
 Glencoe Algebra 1, Student Edition, 9780079039897...AlgebraISBN:9780079039897Author:CarterPublisher:McGraw Hill
 Holt Mcdougal Larson Pre-algebra: Student Edition...AlgebraISBN:9780547587776Author:HOLT MCDOUGALPublisher:HOLT MCDOUGAL