
Videos
Heavenly Chocolates Website Transactions
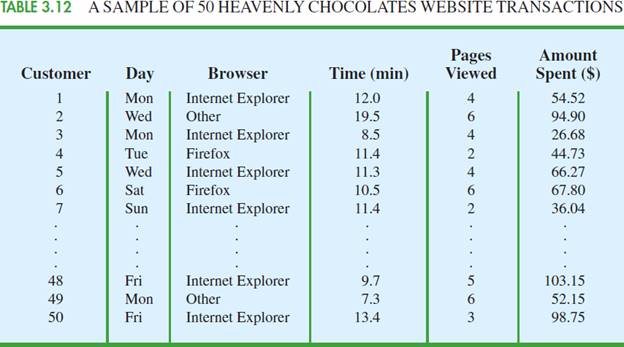
Heavenly Chocolates manufactures and sells quality chocolate products at its plant and retail store located in Saratoga Springs, New York. Two years ago the company developed a website and began selling its products over the Internet. Website sales have exceeded the company’s expectations, and mangement is now considering stragegies to increase sales even further. To learn more about the website customers, a sample of 50 Heavenly Chocolate transactions was selected from the previous month’s sales. Data showing the day of the week each transaction was made, the type of browser the customer used, the time spent on the website, the number of website pages viewed, and the amount spent by each of the 50 customers are contained in the file named Shoppers. A portion of the data are shown in Table 3.12.
Heavenly Chocolates would like to use the sample data to determine if online shoppers who spend more time and view more pages also spend more money during their visit to the website. The company would also like to investigate the effect that the day of the week and the type of browser have on sales.
Managerial Report
Use the methods of
- 1. Graphical and numerical summaries for the length of time the shopper spends on the website, the number of pages viewed, and the mean amount spent per transaction. Discuss what you learn about Heavenly Cholcolates’ online shoppers from these numerical summaries.
- 2. Summarize the frequency, the total dollars spent, and the mean amount spent per transaction for each day of week. What observations can you make about Hevenly Chocolates’ business based on the day of the week? Discuss.
- 3. Summarize the frequency, the total dollars spent, and the mean amount spent per transaction for each type of browser. What observations can you make about Heavenly Chocolate’s business based on the type of browser? Discuss.
- 4. Develop a
scatter diagram and compute the samplecorrelation coefficient to explore the relationship between the time spent on the website and the dollar amount spent. Use the horizontal axis for the time spent on the website. Discuss. - 5. Develop a scatter diagram and compute the sample correlation coefficient to explore the relationship between the the number of website pages viewed and the amount spent. Use the horizontal axis for the number of website pages viewed. Discuss.
- 6. Develop a scatter diagram and compute the sample correlation coefficient to explore the relationship between the time spent on the website and the number of pages viewed. Use the horizontal axis to represent the number of pages viewed. Discuss.

Trending nowThis is a popular solution!

Chapter 3 Solutions
EBK STATISTICS FOR BUSINESS & ECONOMICS


- A survey of 581 citizens found that 313 of them favor a new bill introduced by the city. We want to find a 95% confidence interval for the true proportion of the population who favor the bill. What is the lower limit of the interval? Enter the result as a decimal rounded to 3 decimal digits. Your Answer:arrow_forwardLet X be a continuous RV with PDF where a > 0 and 0 > 0 are parameters. verify that f-∞ /x (x)dx = 1. Find the CDF, Fx (7), of X.arrow_forward6. [20] Let X be a continuous RV with PDF 2(1), 1≤x≤2 fx(x) = 0, otherwisearrow_forward
- A survey of 581 citizens found that 313 of them favor a new bill introduced by the city. We want to find a 95% confidence interval for the true proportion of the population who favor the bill. What is the lower limit of the interval? Enter the result as a decimal rounded to 3 decimal digits. Your Answer:arrow_forwardA survey of 581 citizens found that 313 of them favor a new bill introduced by the city. We want to find a 95% confidence interval for the true proportion of the population who favor the bill. What is the lower limit of the interval? Enter the result as a decimal rounded to 3 decimal digits. Your Answer:arrow_forward2. The SMSA data consisting of 141 observations on 10 variables is fitted by the model below: 1 y = Bo+B1x4 + ẞ2x6 + ẞ3x8 + √1X4X8 + V2X6X8 + €. See Question 2, Tutorial 3 for the meaning of the variables in the above model. The following results are obtained: Estimate Std. Error t value Pr(>|t|) (Intercept) 1.302e+03 4.320e+02 3.015 0.00307 x4 x6 x8 x4:x8 x6:x8 -1.442e+02 2.056e+01 -7.013 1.02e-10 6.340e-01 6.099e+00 0.104 0.91737 -9.455e-02 5.802e-02 -1.630 0.10550 2.882e-02 2.589e-03 11.132 1.673e-03 7.215e-04 2.319 F) x4 1 3486722 3486722 17.9286 4.214e-05 x6 1 14595537 x8 x4:x8 x6:x8 1 132.4836 < 2.2e-16 1045693 194478 5.3769 0.02191 1 1198603043 1198603043 6163.1900 < 2.2e-16 1 25765100 25765100 1045693 Residuals 135 26254490 Estimated variance matrix (Intercept) x4 x6 x8 x4:x8 x6:x8 (Intercept) x4 x6 x8 x4:x8 x6:x8 0.18875694 1.866030e+05 -5.931735e+03 -2.322825e+03 -16.25142055 0.57188953 -5.931735e+03 4.228816e+02 3.160915e+01 0.61621781 -0.03608028 -0.00445013 -2.322825e+03…arrow_forward
- In some applications the distribution of a discrete RV, X resembles the Poisson distribution except that 0 is not a possible value of X. Consider such a RV with PMF where 1 > 0 is a parameter, and c is a constant. (a) Find the expression of c in terms of 1. (b) Find E(X). (Hint: You can use the fact that, if Y ~ Poisson(1), the E(Y) = 1.)arrow_forwardSuppose that X ~Bin(n,p). Show that E[(1 - p)] = (1-p²)".arrow_forwardI need help with this problem and an explanation of the solution for the image described below. (Statistics: Engineering Probabilities)arrow_forward
- I need help with this problem and an explanation of the solution for the image described below. (Statistics: Engineering Probabilities)arrow_forwardThis exercise is based on the following data on four bodybuilding supplements. (Figures shown correspond to a single serving.) Creatine(grams) L-Glutamine(grams) BCAAs(grams) Cost($) Xtend(SciVation) 0 2.5 7 1.00 Gainz(MP Hardcore) 2 3 6 1.10 Strongevity(Bill Phillips) 2.5 1 0 1.20 Muscle Physique(EAS) 2 2 0 1.00 Your personal trainer suggests that you supplement with at least 10 grams of creatine, 39 grams of L-glutamine, and 90 grams of BCAAs each week. You are thinking of combining Xtend and Gainz to provide you with the required nutrients. How many servings of each should you combine to obtain a week's supply that meets your trainer's specifications at the least cost? (If an answer does not exist, enter DNE.) servings of xtend servings of gainzarrow_forwardI need help with this problem and an explanation of the solution for the image described below. (Statistics: Engineering Probabilities)arrow_forward
 Glencoe Algebra 1, Student Edition, 9780079039897...AlgebraISBN:9780079039897Author:CarterPublisher:McGraw Hill
 Big Ideas Math A Bridge To Success Algebra 1: Stu...AlgebraISBN:9781680331141Author:HOUGHTON MIFFLIN HARCOURTPublisher:Houghton Mifflin Harcourt
 Holt Mcdougal Larson Pre-algebra: Student Edition...AlgebraISBN:9780547587776Author:HOLT MCDOUGALPublisher:HOLT MCDOUGAL
 College Algebra (MindTap Course List)AlgebraISBN:9781305652231Author:R. David Gustafson, Jeff HughesPublisher:Cengage Learning