
Mind on Statistics
5th Edition
ISBN: 9781285463186
Author: Jessica M. Utts, Robert F. Heckard
Publisher: Brooks Cole
expand_more
expand_more
format_list_bulleted
Concept explainers
Videos
Textbook Question
Chapter 3, Problem 3.9E
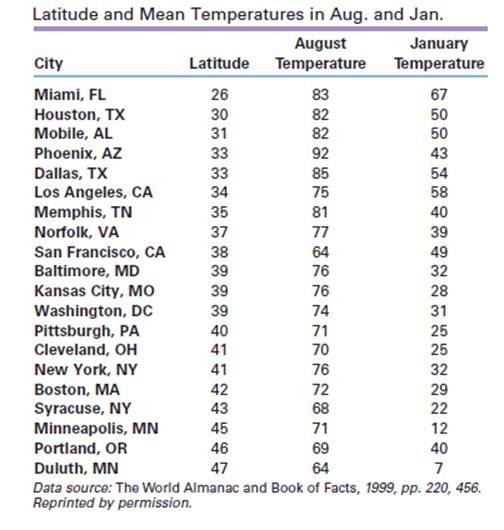
The data in the following table are the geographic latitudes and the average August and January temperatures (Fahrenheit) for 20 cities in the United States. The cities are listed in geographic order from south to north. (These data are part of the temperature dataset on the companion website.)
- Draw a
scatterplot of = August temperature versus x = latitude - Is the pattern linear or curvilinear? What is the direction of the association?
- Are there any cities that appear to be outliers because they don’t fit the pattern of the rest of the data? If so, which city or cities are they?
Expert Solution & Answer
Want to see the full answer?
Check out a sample textbook solution
Students have asked these similar questions
For each of the time series, construct a line chart of the data and identify the characteristics of the time series (that is, random, stationary, trend, seasonal, or cyclical)
Date IBM9/7/2010 $125.959/8/2010 $126.089/9/2010 $126.369/10/2010 $127.999/13/2010 $129.619/14/2010 $128.859/15/2010 $129.439/16/2010 $129.679/17/2010 $130.199/20/2010 $131.79
1. A consumer group claims that the mean annual consumption of cheddar cheese by a person in
the United States is at most 10.3 pounds. A random sample of 100 people in the United States has
a mean annual cheddar cheese consumption of 9.9 pounds. Assume the population standard
deviation is 2.1 pounds. At a = 0.05, can you reject the claim? (Adapted from U.S. Department of
Agriculture)
State the hypotheses:
Calculate the test statistic:
Calculate the P-value:
Conclusion (reject or fail to reject Ho):
2. The CEO of a manufacturing facility claims that the mean workday of the company's assembly
line employees is less than 8.5 hours. A random sample of 25 of the company's assembly line
employees has a mean workday of 8.2 hours. Assume the population standard deviation is 0.5
hour and the population is normally distributed. At a = 0.01, test the CEO's claim.
State the hypotheses:
Calculate the test statistic:
Calculate the P-value:
Conclusion (reject or fail to reject Ho):
Statistics
21.
find the mean.
and
variance of the
following:
Ⓒ x(t) = Ut +V, and V indepriv. s.t
U.VN NL0, 63).
X(t) = t² + Ut +V, U and V incepires have N (0,8)
Ut
①xt = e UNN (0162)
~ X+ = UCOSTE, UNNL0, 62)
SU, Oct
⑤Xt=
7
where U. Vindp.rus
+> ½
have NL, 62).
⑥Xn = ΣY, 41, 42, 43, ... Yn vandom sample
K=1
Text
with mean zen and variance 6
Chapter 3 Solutions
Mind on Statistics
Ch. 3 - For each of the following pairs of variables, is...Ch. 3 - For each of the following pairs of variables, is...Ch. 3 - The figure for this exercise is a scatter plot of...Ch. 3 - Prob. 3.4ECh. 3 - Prob. 3.5ECh. 3 - Prob. 3.6ECh. 3 - Prob. 3.7ECh. 3 - Prob. 3.8ECh. 3 - The data in the following table are the geographic...Ch. 3 - Refer to the latitude and temperature data in the...
Ch. 3 - Prob. 3.11ECh. 3 - The following table shows sex, height (inches),...Ch. 3 - Prob. 3.13ECh. 3 - Refer to Exercise 3.13 in which a regression...Ch. 3 - Prob. 3.15ECh. 3 - Prob. 3.16ECh. 3 - The equation for converting a temperature from x =...Ch. 3 - The average August temperatures (y) and geographic...Ch. 3 - A regression equation for y = handspan (cm) and x...Ch. 3 - Imagine a regression line that relates y average...Ch. 3 - Prob. 3.21ECh. 3 - The figure for Exercise 3.8 is a scatterplot of...Ch. 3 - Refer to Exercise 3.22. Predict the pulse rate...Ch. 3 - The average January temperatures (y) and...Ch. 3 - Prob. 3.25ECh. 3 - Prob. 3.26ECh. 3 - Prob. 3.27ECh. 3 - Remember that r2 can be expressed as a proportion...Ch. 3 - Prob. 3.29ECh. 3 - Prob. 3.30ECh. 3 - Prob. 3.31ECh. 3 - Prob. 3.32ECh. 3 - Prob. 3.33ECh. 3 - Explain how two variables can have a perfect...Ch. 3 - Prob. 3.35ECh. 3 - Prob. 3.36ECh. 3 - The figure for this exercise (below) shows four...Ch. 3 - Refer to the figure for the previous exercises. In...Ch. 3 - Prob. 3.39ECh. 3 - Prob. 3.40ECh. 3 - Prob. 3.41ECh. 3 - Prob. 3.42ECh. 3 - Prob. 3.43ECh. 3 - The correlation between latitude and average...Ch. 3 - Prob. 3.45ECh. 3 - Prob. 3.46ECh. 3 - In a regression analysis, the total sum of squares...Ch. 3 - Prob. 3.48ECh. 3 - Suppose you know that the slope of a regression...Ch. 3 - Prob. 3.50ECh. 3 - Prob. 3.51ECh. 3 - Prob. 3.53ECh. 3 - Prob. 3.54ECh. 3 - Refer back to Exercise 3.7 about stopping distance...Ch. 3 - Prob. 3.56ECh. 3 - Prob. 3.57ECh. 3 - Prob. 3.58ECh. 3 - Prob. 3.59ECh. 3 - Prob. 3.60ECh. 3 - Prob. 3.61ECh. 3 - Prob. 3.62ECh. 3 - Prob. 3.63ECh. 3 - Prob. 3.64ECh. 3 - Prob. 3.65ECh. 3 - Prob. 3.66ECh. 3 - Prob. 3.67ECh. 3 - Prob. 3.68ECh. 3 - Prob. 3.69ECh. 3 - Prob. 3.70ECh. 3 - Prob. 3.71ECh. 3 - Given tickets for traffic violations than drivers...Ch. 3 - Prob. 3.73ECh. 3 - Prob. 3.74ECh. 3 - Prob. 3.75ECh. 3 - Prob. 3.76ECh. 3 - Prob. 3.77ECh. 3 - Prob. 3.78ECh. 3 - Prob. 3.79ECh. 3 - The heights (inches) and foot lengths (cm) of 33...Ch. 3 - Prob. 3.81ECh. 3 - The winning time in the Olympic men’s 500-meter...Ch. 3 - Prob. 3.83ECh. 3 - Prob. 3.84ECh. 3 - Prob. 3.86ECh. 3 - Prob. 3.87ECh. 3 - Prob. 3.88ECh. 3 - Prob. 3.89ECh. 3 - Use the dataset ceodata0t on the companion website...Ch. 3 - Prob. 3.91ECh. 3 - Prob. 3.92ECh. 3 - Prob. 3.93ECh. 3 - Prob. 3.94ECh. 3 - Prob. 3.95ECh. 3 - Prob. 3.96ECh. 3 - Prob. 3.97ECh. 3 - Prob. 3.98ECh. 3 - Prob. 3.99ECh. 3 - Prob. 3.100E
Knowledge Booster


Learn more about
Need a deep-dive on the concept behind this application? Look no further. Learn more about this topic, statistics and related others by exploring similar questions and additional content below.Similar questions
- A psychology researcher conducted a Chi-Square Test of Independence to examine whether there is a relationship between college students’ year in school (Freshman, Sophomore, Junior, Senior) and their preferred coping strategy for academic stress (Problem-Focused, Emotion-Focused, Avoidance). The test yielded the following result: image.png Interpret the results of this analysis. In your response, clearly explain: Whether the result is statistically significant and why. What this means about the relationship between year in school and coping strategy. What the researcher should conclude based on these findings.arrow_forwardA school counselor is conducting a research study to examine whether there is a relationship between the number of times teenagers report vaping per week and their academic performance, measured by GPA. The counselor collects data from a sample of high school students. Write the null and alternative hypotheses for this study. Clearly state your hypotheses in terms of the correlation between vaping frequency and academic performance. EditViewInsertFormatToolsTable 12pt Paragrapharrow_forwardA smallish urn contains 25 small plastic bunnies – 7 of which are pink and 18 of which are white. 10 bunnies are drawn from the urn at random with replacement, and X is the number of pink bunnies that are drawn. (a) P(X = 5) ≈ (b) P(X<6) ≈ The Whoville small urn contains 100 marbles – 60 blue and 40 orange. The Grinch sneaks in one night and grabs a simple random sample (without replacement) of 15 marbles. (a) The probability that the Grinch gets exactly 6 blue marbles is [ Select ] ["≈ 0.054", "≈ 0.043", "≈ 0.061"] . (b) The probability that the Grinch gets at least 7 blue marbles is [ Select ] ["≈ 0.922", "≈ 0.905", "≈ 0.893"] . (c) The probability that the Grinch gets between 8 and 12 blue marbles (inclusive) is [ Select ] ["≈ 0.801", "≈ 0.760", "≈ 0.786"] . The Whoville small urn contains 100 marbles – 60 blue and 40 orange. The Grinch sneaks in one night and grabs a simple random sample (without replacement) of 15 marbles. (a)…arrow_forward
- Suppose an experiment was conducted to compare the mileage(km) per litre obtained by competing brands of petrol I,II,III. Three new Mazda, three new Toyota and three new Nissan cars were available for experimentation. During the experiment the cars would operate under same conditions in order to eliminate the effect of external variables on the distance travelled per litre on the assigned brand of petrol. The data is given as below: Brands of Petrol Mazda Toyota Nissan I 10.6 12.0 11.0 II 9.0 15.0 12.0 III 12.0 17.4 13.0 (a) Test at the 5% level of significance whether there are signi cant differences among the brands of fuels and also among the cars. [10] (b) Compute the standard error for comparing any two fuel brands means. Hence compare, at the 5% level of significance, each of fuel brands II, and III with the standard fuel brand I. [10] �arrow_forwardBusiness discussarrow_forwardWhat would you say about a set of quantitative bivariate data whose linear correlation is -1? What would a scatter diagram of the data look like? (5 points)arrow_forward
- Business discussarrow_forwardAnalyze the residuals of a linear regression model and select the best response. yes, the residual plot does not show a curve no, the residual plot shows a curve yes, the residual plot shows a curve no, the residual plot does not show a curve I answered, "No, the residual plot shows a curve." (and this was incorrect). I am not sure why I keep getting these wrong when the answer seems obvious. Please help me understand what the yes and no references in the answer.arrow_forwarda. Find the value of A.b. Find pX(x) and py(y).c. Find pX|y(x|y) and py|X(y|x)d. Are x and y independent? Why or why not?arrow_forward
- Analyze the residuals of a linear regression model and select the best response.Criteria is simple evaluation of possible indications of an exponential model vs. linear model) no, the residual plot does not show a curve yes, the residual plot does not show a curve yes, the residual plot shows a curve no, the residual plot shows a curve I selected: yes, the residual plot shows a curve and it is INCORRECT. Can u help me understand why?arrow_forwardYou have been hired as an intern to run analyses on the data and report the results back to Sarah; the five questions that Sarah needs you to address are given below. please do it step by step on excel Does there appear to be a positive or negative relationship between price and screen size? Use a scatter plot to examine the relationship. Determine and interpret the correlation coefficient between the two variables. In your interpretation, discuss the direction of the relationship (positive, negative, or zero relationship). Also discuss the strength of the relationship. Estimate the relationship between screen size and price using a simple linear regression model and interpret the estimated coefficients. (In your interpretation, tell the dollar amount by which price will change for each unit of increase in screen size). Include the manufacturer dummy variable (Samsung=1, 0 otherwise) and estimate the relationship between screen size, price and manufacturer dummy as a multiple…arrow_forwardHere is data with as the response variable. x y54.4 19.124.9 99.334.5 9.476.6 0.359.4 4.554.4 0.139.2 56.354 15.773.8 9-156.1 319.2Make a scatter plot of this data. Which point is an outlier? Enter as an ordered pair, e.g., (x,y). (x,y)= Find the regression equation for the data set without the outlier. Enter the equation of the form mx+b rounded to three decimal places. y_wo= Find the regression equation for the data set with the outlier. Enter the equation of the form mx+b rounded to three decimal places. y_w=arrow_forward
arrow_back_ios
SEE MORE QUESTIONS
arrow_forward_ios
Recommended textbooks for you
 Glencoe Algebra 1, Student Edition, 9780079039897...AlgebraISBN:9780079039897Author:CarterPublisher:McGraw Hill
 Holt Mcdougal Larson Pre-algebra: Student Edition...AlgebraISBN:9780547587776Author:HOLT MCDOUGALPublisher:HOLT MCDOUGAL
 Big Ideas Math A Bridge To Success Algebra 1: Stu...AlgebraISBN:9781680331141Author:HOUGHTON MIFFLIN HARCOURTPublisher:Houghton Mifflin Harcourt
 Elementary Geometry for College StudentsGeometryISBN:9781285195698Author:Daniel C. Alexander, Geralyn M. KoeberleinPublisher:Cengage Learning
 Functions and Change: A Modeling Approach to Coll...AlgebraISBN:9781337111348Author:Bruce Crauder, Benny Evans, Alan NoellPublisher:Cengage Learning
 Trigonometry (MindTap Course List)TrigonometryISBN:9781305652224Author:Charles P. McKeague, Mark D. TurnerPublisher:Cengage Learning
Glencoe Algebra 1, Student Edition, 9780079039897...
Algebra
ISBN:9780079039897
Author:Carter
Publisher:McGraw Hill
Holt Mcdougal Larson Pre-algebra: Student Edition...
Algebra
ISBN:9780547587776
Author:HOLT MCDOUGAL
Publisher:HOLT MCDOUGAL
Big Ideas Math A Bridge To Success Algebra 1: Stu...
Algebra
ISBN:9781680331141
Author:HOUGHTON MIFFLIN HARCOURT
Publisher:Houghton Mifflin Harcourt
Elementary Geometry for College Students
Geometry
ISBN:9781285195698
Author:Daniel C. Alexander, Geralyn M. Koeberlein
Publisher:Cengage Learning
Functions and Change: A Modeling Approach to Coll...
Algebra
ISBN:9781337111348
Author:Bruce Crauder, Benny Evans, Alan Noell
Publisher:Cengage Learning
Trigonometry (MindTap Course List)
Trigonometry
ISBN:9781305652224
Author:Charles P. McKeague, Mark D. Turner
Publisher:Cengage Learning
Correlation Vs Regression: Difference Between them with definition & Comparison Chart; Author: Key Differences;https://www.youtube.com/watch?v=Ou2QGSJVd0U;License: Standard YouTube License, CC-BY
Correlation and Regression: Concepts with Illustrative examples; Author: LEARN & APPLY : Lean and Six Sigma;https://www.youtube.com/watch?v=xTpHD5WLuoA;License: Standard YouTube License, CC-BY