
Mind on Statistics
5th Edition
ISBN: 9781285463186
Author: Jessica M. Utts, Robert F. Heckard
Publisher: Brooks Cole
expand_more
expand_more
format_list_bulleted
Concept explainers
Videos
Textbook Question
Chapter 3, Problem 3.37E
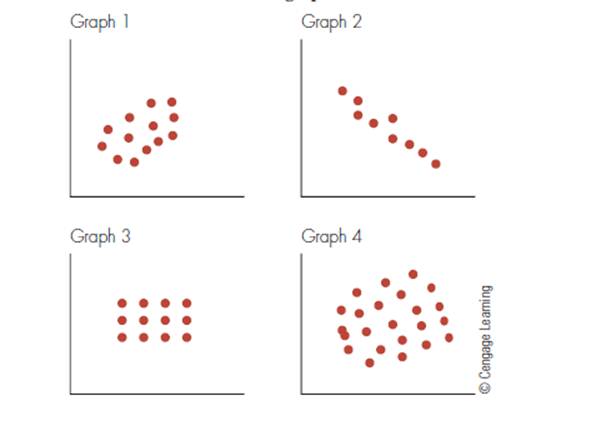
The figure for this exercise (below) shows four graphs. Assume that all four graphs have the same numerical scales for the two axes. Which graph shows the strongest relationship between the two variables? Which graph shows the weakest? Graph 1 Graph 2
Expert Solution & Answer
Want to see the full answer?
Check out a sample textbook solution
Students have asked these similar questions
Find the critical value for a left-tailed test using the F distribution with a 0.025, degrees of freedom in the numerator=12, and degrees of freedom in the
denominator = 50. A portion of the table of critical values of the F-distribution is provided.
Click the icon to view the partial table of critical values of the F-distribution.
What is the critical value?
(Round to two decimal places as needed.)
A retail store manager claims that the average daily sales of the store are $1,500.
You aim to test whether the actual average daily sales differ significantly from this claimed value.
You can provide your answer by inserting a text box and the answer must include:
Null hypothesis,
Alternative hypothesis,
Show answer (output table/summary table), and
Conclusion based on the P value.
Showing the calculation is a must. If calculation is missing,so please provide a step by step on the answers
Numerical answers in the yellow cells
Show all work
Chapter 3 Solutions
Mind on Statistics
Ch. 3 - For each of the following pairs of variables, is...Ch. 3 - For each of the following pairs of variables, is...Ch. 3 - The figure for this exercise is a scatter plot of...Ch. 3 - Prob. 3.4ECh. 3 - Prob. 3.5ECh. 3 - Prob. 3.6ECh. 3 - Prob. 3.7ECh. 3 - Prob. 3.8ECh. 3 - The data in the following table are the geographic...Ch. 3 - Refer to the latitude and temperature data in the...
Ch. 3 - Prob. 3.11ECh. 3 - The following table shows sex, height (inches),...Ch. 3 - Prob. 3.13ECh. 3 - Refer to Exercise 3.13 in which a regression...Ch. 3 - Prob. 3.15ECh. 3 - Prob. 3.16ECh. 3 - The equation for converting a temperature from x =...Ch. 3 - The average August temperatures (y) and geographic...Ch. 3 - A regression equation for y = handspan (cm) and x...Ch. 3 - Imagine a regression line that relates y average...Ch. 3 - Prob. 3.21ECh. 3 - The figure for Exercise 3.8 is a scatterplot of...Ch. 3 - Refer to Exercise 3.22. Predict the pulse rate...Ch. 3 - The average January temperatures (y) and...Ch. 3 - Prob. 3.25ECh. 3 - Prob. 3.26ECh. 3 - Prob. 3.27ECh. 3 - Remember that r2 can be expressed as a proportion...Ch. 3 - Prob. 3.29ECh. 3 - Prob. 3.30ECh. 3 - Prob. 3.31ECh. 3 - Prob. 3.32ECh. 3 - Prob. 3.33ECh. 3 - Explain how two variables can have a perfect...Ch. 3 - Prob. 3.35ECh. 3 - Prob. 3.36ECh. 3 - The figure for this exercise (below) shows four...Ch. 3 - Refer to the figure for the previous exercises. In...Ch. 3 - Prob. 3.39ECh. 3 - Prob. 3.40ECh. 3 - Prob. 3.41ECh. 3 - Prob. 3.42ECh. 3 - Prob. 3.43ECh. 3 - The correlation between latitude and average...Ch. 3 - Prob. 3.45ECh. 3 - Prob. 3.46ECh. 3 - In a regression analysis, the total sum of squares...Ch. 3 - Prob. 3.48ECh. 3 - Suppose you know that the slope of a regression...Ch. 3 - Prob. 3.50ECh. 3 - Prob. 3.51ECh. 3 - Prob. 3.53ECh. 3 - Prob. 3.54ECh. 3 - Refer back to Exercise 3.7 about stopping distance...Ch. 3 - Prob. 3.56ECh. 3 - Prob. 3.57ECh. 3 - Prob. 3.58ECh. 3 - Prob. 3.59ECh. 3 - Prob. 3.60ECh. 3 - Prob. 3.61ECh. 3 - Prob. 3.62ECh. 3 - Prob. 3.63ECh. 3 - Prob. 3.64ECh. 3 - Prob. 3.65ECh. 3 - Prob. 3.66ECh. 3 - Prob. 3.67ECh. 3 - Prob. 3.68ECh. 3 - Prob. 3.69ECh. 3 - Prob. 3.70ECh. 3 - Prob. 3.71ECh. 3 - Given tickets for traffic violations than drivers...Ch. 3 - Prob. 3.73ECh. 3 - Prob. 3.74ECh. 3 - Prob. 3.75ECh. 3 - Prob. 3.76ECh. 3 - Prob. 3.77ECh. 3 - Prob. 3.78ECh. 3 - Prob. 3.79ECh. 3 - The heights (inches) and foot lengths (cm) of 33...Ch. 3 - Prob. 3.81ECh. 3 - The winning time in the Olympic men’s 500-meter...Ch. 3 - Prob. 3.83ECh. 3 - Prob. 3.84ECh. 3 - Prob. 3.86ECh. 3 - Prob. 3.87ECh. 3 - Prob. 3.88ECh. 3 - Prob. 3.89ECh. 3 - Use the dataset ceodata0t on the companion website...Ch. 3 - Prob. 3.91ECh. 3 - Prob. 3.92ECh. 3 - Prob. 3.93ECh. 3 - Prob. 3.94ECh. 3 - Prob. 3.95ECh. 3 - Prob. 3.96ECh. 3 - Prob. 3.97ECh. 3 - Prob. 3.98ECh. 3 - Prob. 3.99ECh. 3 - Prob. 3.100E
Knowledge Booster


Learn more about
Need a deep-dive on the concept behind this application? Look no further. Learn more about this topic, statistics and related others by exploring similar questions and additional content below.Similar questions
- Show all workarrow_forwardplease find the answers for the yellows boxes using the information and the picture belowarrow_forwardA marketing agency wants to determine whether different advertising platforms generate significantly different levels of customer engagement. The agency measures the average number of daily clicks on ads for three platforms: Social Media, Search Engines, and Email Campaigns. The agency collects data on daily clicks for each platform over a 10-day period and wants to test whether there is a statistically significant difference in the mean number of daily clicks among these platforms. Conduct ANOVA test. You can provide your answer by inserting a text box and the answer must include: also please provide a step by on getting the answers in excel Null hypothesis, Alternative hypothesis, Show answer (output table/summary table), and Conclusion based on the P value.arrow_forward
- A company found that the daily sales revenue of its flagship product follows a normal distribution with a mean of $4500 and a standard deviation of $450. The company defines a "high-sales day" that is, any day with sales exceeding $4800. please provide a step by step on how to get the answers Q: What percentage of days can the company expect to have "high-sales days" or sales greater than $4800? Q: What is the sales revenue threshold for the bottom 10% of days? (please note that 10% refers to the probability/area under bell curve towards the lower tail of bell curve) Provide answers in the yellow cellsarrow_forwardBusiness Discussarrow_forwardThe following data represent total ventilation measured in liters of air per minute per square meter of body area for two independent (and randomly chosen) samples. Analyze these data using the appropriate non-parametric hypothesis testarrow_forward
arrow_back_ios
SEE MORE QUESTIONS
arrow_forward_ios
Recommended textbooks for you
 Glencoe Algebra 1, Student Edition, 9780079039897...AlgebraISBN:9780079039897Author:CarterPublisher:McGraw Hill
 Algebra & Trigonometry with Analytic GeometryAlgebraISBN:9781133382119Author:SwokowskiPublisher:Cengage
 Elementary AlgebraAlgebraISBN:9780998625713Author:Lynn Marecek, MaryAnne Anthony-SmithPublisher:OpenStax - Rice University
 Algebra: Structure And Method, Book 1AlgebraISBN:9780395977224Author:Richard G. Brown, Mary P. Dolciani, Robert H. Sorgenfrey, William L. ColePublisher:McDougal Littell
Glencoe Algebra 1, Student Edition, 9780079039897...
Algebra
ISBN:9780079039897
Author:Carter
Publisher:McGraw Hill
Algebra & Trigonometry with Analytic Geometry
Algebra
ISBN:9781133382119
Author:Swokowski
Publisher:Cengage
Elementary Algebra
Algebra
ISBN:9780998625713
Author:Lynn Marecek, MaryAnne Anthony-Smith
Publisher:OpenStax - Rice University
Algebra: Structure And Method, Book 1
Algebra
ISBN:9780395977224
Author:Richard G. Brown, Mary P. Dolciani, Robert H. Sorgenfrey, William L. Cole
Publisher:McDougal Littell
Correlation Vs Regression: Difference Between them with definition & Comparison Chart; Author: Key Differences;https://www.youtube.com/watch?v=Ou2QGSJVd0U;License: Standard YouTube License, CC-BY
Correlation and Regression: Concepts with Illustrative examples; Author: LEARN & APPLY : Lean and Six Sigma;https://www.youtube.com/watch?v=xTpHD5WLuoA;License: Standard YouTube License, CC-BY