
Mind on Statistics
5th Edition
ISBN: 9781285463186
Author: Jessica M. Utts, Robert F. Heckard
Publisher: Brooks Cole
expand_more
expand_more
format_list_bulleted
Concept explainers
Videos
Textbook Question
Chapter 3, Problem 3.3E
The figure for this exercise is a
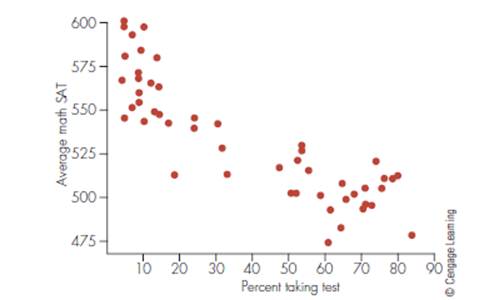
- Does the plot show a positive association, a negative association, or no association between the two variables? Explain.
Expert Solution & Answer
Want to see the full answer?
Check out a sample textbook solution
Students have asked these similar questions
Business
https://www.hawkeslearning.com/Statistics/dbs2/datasets.html
NC Current Students - North Ce X | NC Canvas Login Links - North ( X
Final Exam Comprehensive x Cengage Learning
x
WASTAT - Final Exam - STAT
→
C
webassign.net/web/Student/Assignment-Responses/submit?dep=36055360&tags=autosave#question3659890_9
Part (b)
Draw a scatter plot of the ordered pairs.
N
Life
Expectancy
Life
Expectancy
80
70
600
50
40
30
20
10
Year of
1950
1970 1990
2010 Birth
O
Life
Expectancy
Part (c)
800
70
60
50
40
30
20
10
1950
1970 1990
W
ALT
林
$
#
4
R
J7
Year of
2010 Birth
F6
4+
80
70
60
50
40
30
20
10
Year of
1950 1970 1990
2010 Birth
Life
Expectancy
Ox
800
70
60
50
40
30
20
10
Year of
1950 1970 1990 2010 Birth
hp
P.B.
KA
&
7
80
% 5
H
A
B
F10
711
N
M
K
744
PRT SC
ALT
CTRL
Chapter 3 Solutions
Mind on Statistics
Ch. 3 - For each of the following pairs of variables, is...Ch. 3 - For each of the following pairs of variables, is...Ch. 3 - The figure for this exercise is a scatter plot of...Ch. 3 - Prob. 3.4ECh. 3 - Prob. 3.5ECh. 3 - Prob. 3.6ECh. 3 - Prob. 3.7ECh. 3 - Prob. 3.8ECh. 3 - The data in the following table are the geographic...Ch. 3 - Refer to the latitude and temperature data in the...
Ch. 3 - Prob. 3.11ECh. 3 - The following table shows sex, height (inches),...Ch. 3 - Prob. 3.13ECh. 3 - Refer to Exercise 3.13 in which a regression...Ch. 3 - Prob. 3.15ECh. 3 - Prob. 3.16ECh. 3 - The equation for converting a temperature from x =...Ch. 3 - The average August temperatures (y) and geographic...Ch. 3 - A regression equation for y = handspan (cm) and x...Ch. 3 - Imagine a regression line that relates y average...Ch. 3 - Prob. 3.21ECh. 3 - The figure for Exercise 3.8 is a scatterplot of...Ch. 3 - Refer to Exercise 3.22. Predict the pulse rate...Ch. 3 - The average January temperatures (y) and...Ch. 3 - Prob. 3.25ECh. 3 - Prob. 3.26ECh. 3 - Prob. 3.27ECh. 3 - Remember that r2 can be expressed as a proportion...Ch. 3 - Prob. 3.29ECh. 3 - Prob. 3.30ECh. 3 - Prob. 3.31ECh. 3 - Prob. 3.32ECh. 3 - Prob. 3.33ECh. 3 - Explain how two variables can have a perfect...Ch. 3 - Prob. 3.35ECh. 3 - Prob. 3.36ECh. 3 - The figure for this exercise (below) shows four...Ch. 3 - Refer to the figure for the previous exercises. In...Ch. 3 - Prob. 3.39ECh. 3 - Prob. 3.40ECh. 3 - Prob. 3.41ECh. 3 - Prob. 3.42ECh. 3 - Prob. 3.43ECh. 3 - The correlation between latitude and average...Ch. 3 - Prob. 3.45ECh. 3 - Prob. 3.46ECh. 3 - In a regression analysis, the total sum of squares...Ch. 3 - Prob. 3.48ECh. 3 - Suppose you know that the slope of a regression...Ch. 3 - Prob. 3.50ECh. 3 - Prob. 3.51ECh. 3 - Prob. 3.53ECh. 3 - Prob. 3.54ECh. 3 - Refer back to Exercise 3.7 about stopping distance...Ch. 3 - Prob. 3.56ECh. 3 - Prob. 3.57ECh. 3 - Prob. 3.58ECh. 3 - Prob. 3.59ECh. 3 - Prob. 3.60ECh. 3 - Prob. 3.61ECh. 3 - Prob. 3.62ECh. 3 - Prob. 3.63ECh. 3 - Prob. 3.64ECh. 3 - Prob. 3.65ECh. 3 - Prob. 3.66ECh. 3 - Prob. 3.67ECh. 3 - Prob. 3.68ECh. 3 - Prob. 3.69ECh. 3 - Prob. 3.70ECh. 3 - Prob. 3.71ECh. 3 - Given tickets for traffic violations than drivers...Ch. 3 - Prob. 3.73ECh. 3 - Prob. 3.74ECh. 3 - Prob. 3.75ECh. 3 - Prob. 3.76ECh. 3 - Prob. 3.77ECh. 3 - Prob. 3.78ECh. 3 - Prob. 3.79ECh. 3 - The heights (inches) and foot lengths (cm) of 33...Ch. 3 - Prob. 3.81ECh. 3 - The winning time in the Olympic men’s 500-meter...Ch. 3 - Prob. 3.83ECh. 3 - Prob. 3.84ECh. 3 - Prob. 3.86ECh. 3 - Prob. 3.87ECh. 3 - Prob. 3.88ECh. 3 - Prob. 3.89ECh. 3 - Use the dataset ceodata0t on the companion website...Ch. 3 - Prob. 3.91ECh. 3 - Prob. 3.92ECh. 3 - Prob. 3.93ECh. 3 - Prob. 3.94ECh. 3 - Prob. 3.95ECh. 3 - Prob. 3.96ECh. 3 - Prob. 3.97ECh. 3 - Prob. 3.98ECh. 3 - Prob. 3.99ECh. 3 - Prob. 3.100E
Knowledge Booster


Learn more about
Need a deep-dive on the concept behind this application? Look no further. Learn more about this topic, statistics and related others by exploring similar questions and additional content below.Similar questions
- Harvard University California Institute of Technology Massachusetts Institute of Technology Stanford University Princeton University University of Cambridge University of Oxford University of California, Berkeley Imperial College London Yale University University of California, Los Angeles University of Chicago Johns Hopkins University Cornell University ETH Zurich University of Michigan University of Toronto Columbia University University of Pennsylvania Carnegie Mellon University University of Hong Kong University College London University of Washington Duke University Northwestern University University of Tokyo Georgia Institute of Technology Pohang University of Science and Technology University of California, Santa Barbara University of British Columbia University of North Carolina at Chapel Hill University of California, San Diego University of Illinois at Urbana-Champaign National University of Singapore McGill…arrow_forwardName Harvard University California Institute of Technology Massachusetts Institute of Technology Stanford University Princeton University University of Cambridge University of Oxford University of California, Berkeley Imperial College London Yale University University of California, Los Angeles University of Chicago Johns Hopkins University Cornell University ETH Zurich University of Michigan University of Toronto Columbia University University of Pennsylvania Carnegie Mellon University University of Hong Kong University College London University of Washington Duke University Northwestern University University of Tokyo Georgia Institute of Technology Pohang University of Science and Technology University of California, Santa Barbara University of British Columbia University of North Carolina at Chapel Hill University of California, San Diego University of Illinois at Urbana-Champaign National University of Singapore…arrow_forwardA company found that the daily sales revenue of its flagship product follows a normal distribution with a mean of $4500 and a standard deviation of $450. The company defines a "high-sales day" that is, any day with sales exceeding $4800. please provide a step by step on how to get the answers in excel Q: What percentage of days can the company expect to have "high-sales days" or sales greater than $4800? Q: What is the sales revenue threshold for the bottom 10% of days? (please note that 10% refers to the probability/area under bell curve towards the lower tail of bell curve) Provide answers in the yellow cellsarrow_forward
- Find the critical value for a left-tailed test using the F distribution with a 0.025, degrees of freedom in the numerator=12, and degrees of freedom in the denominator = 50. A portion of the table of critical values of the F-distribution is provided. Click the icon to view the partial table of critical values of the F-distribution. What is the critical value? (Round to two decimal places as needed.)arrow_forwardA retail store manager claims that the average daily sales of the store are $1,500. You aim to test whether the actual average daily sales differ significantly from this claimed value. You can provide your answer by inserting a text box and the answer must include: Null hypothesis, Alternative hypothesis, Show answer (output table/summary table), and Conclusion based on the P value. Showing the calculation is a must. If calculation is missing,so please provide a step by step on the answers Numerical answers in the yellow cellsarrow_forwardShow all workarrow_forward
arrow_back_ios
SEE MORE QUESTIONS
arrow_forward_ios
Recommended textbooks for you
 Glencoe Algebra 1, Student Edition, 9780079039897...AlgebraISBN:9780079039897Author:CarterPublisher:McGraw Hill
 Holt Mcdougal Larson Pre-algebra: Student Edition...AlgebraISBN:9780547587776Author:HOLT MCDOUGALPublisher:HOLT MCDOUGAL
 Big Ideas Math A Bridge To Success Algebra 1: Stu...AlgebraISBN:9781680331141Author:HOUGHTON MIFFLIN HARCOURTPublisher:Houghton Mifflin Harcourt
 Algebra and Trigonometry (MindTap Course List)AlgebraISBN:9781305071742Author:James Stewart, Lothar Redlin, Saleem WatsonPublisher:Cengage Learning
 College AlgebraAlgebraISBN:9781305115545Author:James Stewart, Lothar Redlin, Saleem WatsonPublisher:Cengage Learning
 Functions and Change: A Modeling Approach to Coll...AlgebraISBN:9781337111348Author:Bruce Crauder, Benny Evans, Alan NoellPublisher:Cengage Learning
Glencoe Algebra 1, Student Edition, 9780079039897...
Algebra
ISBN:9780079039897
Author:Carter
Publisher:McGraw Hill
Holt Mcdougal Larson Pre-algebra: Student Edition...
Algebra
ISBN:9780547587776
Author:HOLT MCDOUGAL
Publisher:HOLT MCDOUGAL
Big Ideas Math A Bridge To Success Algebra 1: Stu...
Algebra
ISBN:9781680331141
Author:HOUGHTON MIFFLIN HARCOURT
Publisher:Houghton Mifflin Harcourt
Algebra and Trigonometry (MindTap Course List)
Algebra
ISBN:9781305071742
Author:James Stewart, Lothar Redlin, Saleem Watson
Publisher:Cengage Learning
College Algebra
Algebra
ISBN:9781305115545
Author:James Stewart, Lothar Redlin, Saleem Watson
Publisher:Cengage Learning
Functions and Change: A Modeling Approach to Coll...
Algebra
ISBN:9781337111348
Author:Bruce Crauder, Benny Evans, Alan Noell
Publisher:Cengage Learning
Which is the best chart: Selecting among 14 types of charts Part II; Author: 365 Data Science;https://www.youtube.com/watch?v=qGaIB-bRn-A;License: Standard YouTube License, CC-BY