
Videos
Case Problem 5 African Elephant Populations
Although millions of elephants once roamed across Africa, by the mid-1980s elephant populations in African nations had been devastated by poaching. Elephants are important to African ecosystems. In tropical forests, elephants create clearings in the canopy that encourage new tree growth. In savannas, elephants reduce bush cover to create an environment that is favorable to browsing and grazing animals. In addition, the seeds of many plant species on passing through an elephant's digestive tract germination.
The status of the elephant now varies greatly across the continent; in some nations, strong measures have been taken to effectively protect elephant populations, while in other nations the elephant populations remain in danger due to poaching for meat and ivory, loss of habitat, and conflict with humans. Table 3.13 shows elephant populations for several African nations in 1979, 1989, and 2007 (Lemieux and Clarke, "The International Ban on Ivory Sales and Its
Effects on Elephant Poaching in Africa." British Journal of Criminology, 49(4), 2009).
The David Sheldrick Wildlife Trust was established in 1977 to honor the memory of naturalist David Leslie William Sheldrick, who founded Warden of Tsavo East National Park in Kenya and headed the Planning Unit of the Wildlife Conservation and Management Department in that country. Management of the Sheldrick Trust would like to know what these data indicate about elephant populations in various African countries since 1979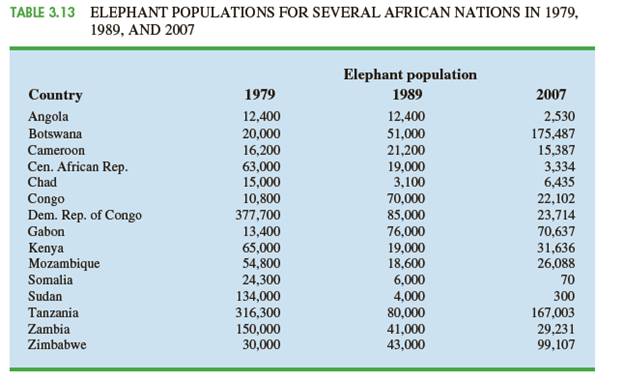 Managerial Report
Use methods of
3. A comparison of your results from parts 1 and 2, and a discussion of the conclusions you can draw from this comparison.
Want to see the full answer?
Check out a sample textbook solution
Chapter 3 Solutions
Essentials of Modern Business Statistics with Microsoft Office Excel (with XLSTAT Education Edition Printed Access Card) (MindTap Course List)


- 2PM Tue Mar 4 7 Dashboard Calendar To Do Notifications Inbox File Details a 25/SP-CIT-105-02 Statics for Technicians Q-7 Determine the resultant of the load system shown. Locate where the resultant intersects grade with respect to point A at the base of the structure. 40 N/m 2 m 1.5 m 50 N 100 N/m Fig.- Problem-7 4 m Gradearrow_forwardNsjsjsjarrow_forwardA smallish urn contains 16 small plastic bunnies - 9 of which are pink and 7 of which are white. 10 bunnies are drawn from the urn at random with replacement, and X is the number of pink bunnies that are drawn. (a) P(X=6)[Select] (b) P(X>7) ≈ [Select]arrow_forward
- A smallish urn contains 25 small plastic bunnies - 7 of which are pink and 18 of which are white. 10 bunnies are drawn from the urn at random with replacement, and X is the number of pink bunnies that are drawn. (a) P(X = 5)=[Select] (b) P(X<6) [Select]arrow_forwardElementary StatisticsBase on the same given data uploaded in module 4, will you conclude that the number of bathroom of houses is a significant factor for house sellprice? I your answer is affirmative, you need to explain how the number of bathroom influences the house price, using a post hoc procedure. (Please treat number of bathrooms as a categorical variable in this analysis)Base on the same given data, conduct an analysis for the variable sellprice to see if sale price is influenced by living area. Summarize your finding including all regular steps (learned in this module) for your method. Also, will you conclude that larger house corresponding to higher price (justify)?Each question need to include a spss or sas output. Instructions: You have to use SAS or SPSS to perform appropriate procedure: ANOVA or Regression based on the project data (provided in the module 4) and research question in the project file. Attach the computer output of all key steps (number) quoted in…arrow_forwardElementary StatsBase on the given data uploaded in module 4, change the variable sale price into two categories: abovethe mean price or not; and change the living area into two categories: above the median living area ornot ( your two group should have close number of houses in each group). Using the resulting variables,will you conclude that larger house corresponding to higher price?Note: Need computer output, Ho and Ha, P and decision. If p is small, you need to explain what type ofdependency (association) we have using an appropriate pair of percentages. Please include how to use the data in SPSS and interpretation of data.arrow_forward
- An environmental research team is studying the daily rainfall (in millimeters) in a region over 100 days. The data is grouped into the following histogram bins: Rainfall Range (mm) Frequency 0-9.9 15 10 19.9 25 20-29.9 30 30-39.9 20 ||40-49.9 10 a) If a random day is selected, what is the probability that the rainfall was at least 20 mm but less than 40 mm? b) Estimate the mean daily rainfall, assuming the rainfall in each bin is uniformly distributed and the midpoint of each bin represents the average rainfall for that range. c) Construct the cumulative frequency distribution and determine the rainfall level below which 75% of the days fall. d) Calculate the estimated variance and standard deviation of the daily rainfall based on the histogram data.arrow_forwardAn electronics company manufactures batches of n circuit boards. Before a batch is approved for shipment, m boards are randomly selected from the batch and tested. The batch is rejected if more than d boards in the sample are found to be faulty. a) A batch actually contains six faulty circuit boards. Find the probability that the batch is rejected when n = 20, m = 5, and d = 1. b) A batch actually contains nine faulty circuit boards. Find the probability that the batch is rejected when n = 30, m = 10, and d = 1.arrow_forwardTwenty-eight applicants interested in working for the Food Stamp program took an examination designed to measure their aptitude for social work. A stem-and-leaf plot of the 28 scores appears below, where the first column is the count per branch, the second column is the stem value, and the remaining digits are the leaves. a) List all the values. Count 1 Stems Leaves 4 6 1 4 6 567 9 3688 026799 9 8 145667788 7 9 1234788 b) Calculate the first quartile (Q1) and the third Quartile (Q3). c) Calculate the interquartile range. d) Construct a boxplot for this data.arrow_forward
- Pam, Rob and Sam get a cake that is one-third chocolate, one-third vanilla, and one-third strawberry as shown below. They wish to fairly divide the cake using the lone chooser method. Pam likes strawberry twice as much as chocolate or vanilla. Rob only likes chocolate. Sam, the chooser, likes vanilla and strawberry twice as much as chocolate. In the first division, Pam cuts the strawberry piece off and lets Rob choose his favorite piece. Based on that, Rob chooses the chocolate and vanilla parts. Note: All cuts made to the cake shown below are vertical.Which is a second division that Rob would make of his share of the cake?arrow_forwardThree players (one divider and two choosers) are going to divide a cake fairly using the lone divider method. The divider cuts the cake into three slices (s1, s2, and s3). If the choosers' declarations are Chooser 1: {s1 , s2} and Chooser 2: {s2 , s3}. Using the lone-divider method, how many different fair divisions of this cake are possible?arrow_forwardTheorem 2.6 (The Minkowski inequality) Let p≥1. Suppose that X and Y are random variables, such that E|X|P <∞ and E|Y P <00. Then X+YpX+Yparrow_forward
 Linear Algebra: A Modern IntroductionAlgebraISBN:9781285463247Author:David PoolePublisher:Cengage Learning