a.
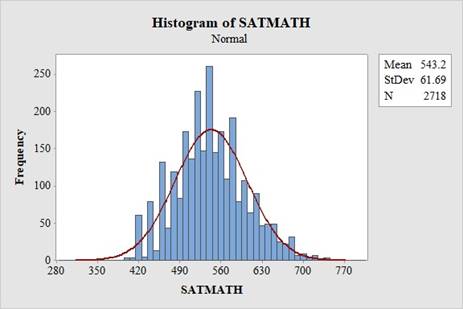
To draw: A histogram with a superimposed normal curve.
a.
Answer to Problem 3.49E
The obtained histogram with a superimposed normal curve is,
Explanation of Solution
Given info:
The data of SATMATH are given.
Calculation:
Histogram:
Software Procedure:
Step by step procedure to obtain Histogram is given as:
- Choose Graph > Histogram.
- Choose With Fit, and then click OK.
- In Graph variables, enter the corresponding data column SATMATH.
- Click OK.
The output using Minitab software is given as:
b.
To find: The
To compare: The mean and the median.
To compare: The quartiles.
b.
Answer to Problem 3.49E
The mean, median, standard deviation, 1st quartile, 2nd quartile are 543.2, 540, 61.69, 500 and 580, respectively.
The distribution is symmetric.
Explanation of Solution
Calculation:
Software Procedure:
Step by step procedure to obtain the inter
- Choose Stat > Basic Statistics > Display Descriptive Statistics.
- In Variables enter the columns SAT.
- In statistics choose Mean, Median, Standard deviation, 1st quartile, 3rd quartile..
- Click OK.
Output using the MINITAB software is given below:
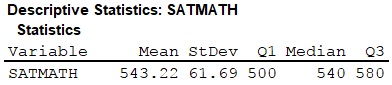
From the MINITAB output,
The mean is 543.2.
The standard deviation is 61.69.
The 1st quartile is 500.
The median is 540.
The 3rd quartile is 580.
Comparison between mean and median:
If mean is equal to the median then it is said to be symmetric.
Here, the mean is close to the median. Thus, the distribution is symmetric.
Distance of the first quartile from the median:
The formula to find the distance of the first quartile from the median is,
Thus, the distance of the first quartile from the median is 40.
Distance of the first quartile from the median:
The formula to find the distance of the third quartile from the median is,
Thus, the distance of the third quartile from the median is 40.
Here, the distance of the first quartile from the median is approximately equal to distance of the third quartile from the median. That is,
Hence, the distribution of the rainwater specimens is quite symmetric.
c.
To find: The proportion of GSU freshmen scored above the mean 514 for all college-bound seniors.
c.
Answer to Problem 3.49E
The proportion of GSU freshmen scored above the mean 514 for all college-bound seniors is 0.6808.
Explanation of Solution
The formula to find the standardized score is,
In 2013, the mean score on the mathematics portion of the SAT for all college-bound seniors was 514.
The distribution of first 20 SAT mathematics scores follow
Consider the random variable X, denotes those students of first 20 SAT mathematics scores.
Thus,
It is known that,
Thus,
Cumulative probability value:
Software Procedure:
Step by step procedure to obtain the graph using the MINITAB software:
- Choose Calc > Probability distribution> Normal.
- Choose Cumulative Probability.
- In mean, enter 0.
- In standard deviation, enter 1.
- Choose Input Constant.
- In Input Constant, enter -0.47.
- Click OK.
Output using the MINITAB software is given below:
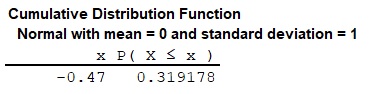
Thus,
Therefore, the proportion of GSU freshmen scored above the mean for all college-bound seniors is 0.6808.
d.
To find: The exact proportion of GSU freshmen who scored above the mean for all college-bound seniors.
d.
Answer to Problem 3.49E
The exact proportion of GSU freshmen who scored above the mean for all college-bound seniors is 0.6840.
Explanation of Solution
It is found from the data that 1,859 students, out of a total of 2,718 students have scored above the mean score 514 for all college-bound seniors.
Thus, the exact proportion of GSU freshmen who scored above the mean for all college-bound seniors is:
From part (c), the proportion of GSU freshmen scored above the mean 514 for all college-bound seniors, for normal distribution is 0.6808 or 68.08%.
Here, the exact proportion of GSU freshmen who scored above the mean for all college-bound seniors is 0.6840 or 68.40%.
It can be said that
Thus, the exact percentage obtained from part (d) and the percentage obtained from part (c) are very close.
Thus, despite any discrepancies, the distribution can be considered to be “close enough to Normal” distribution.
Want to see more full solutions like this?
Chapter 3 Solutions
Loose-leaf Version for The Basic Practice of Statistics 7e & LaunchPad (Twelve Month Access)

- Pls help asaparrow_forwardSolve the following LP problem using the Extreme Point Theorem: Subject to: Maximize Z-6+4y 2+y≤8 2x + y ≤10 2,y20 Solve it using the graphical method. Guidelines for preparation for the teacher's questions: Understand the basics of Linear Programming (LP) 1. Know how to formulate an LP model. 2. Be able to identify decision variables, objective functions, and constraints. Be comfortable with graphical solutions 3. Know how to plot feasible regions and find extreme points. 4. Understand how constraints affect the solution space. Understand the Extreme Point Theorem 5. Know why solutions always occur at extreme points. 6. Be able to explain how optimization changes with different constraints. Think about real-world implications 7. Consider how removing or modifying constraints affects the solution. 8. Be prepared to explain why LP problems are used in business, economics, and operations research.arrow_forwardged the variance for group 1) Different groups of male stalk-eyed flies were raised on different diets: a high nutrient corn diet vs. a low nutrient cotton wool diet. Investigators wanted to see if diet quality influenced eye-stalk length. They obtained the following data: d Diet Sample Mean Eye-stalk Length Variance in Eye-stalk d size, n (mm) Length (mm²) Corn (group 1) 21 2.05 0.0558 Cotton (group 2) 24 1.54 0.0812 =205-1.54-05T a) Construct a 95% confidence interval for the difference in mean eye-stalk length between the two diets (e.g., use group 1 - group 2).arrow_forward
- An article in Business Week discussed the large spread between the federal funds rate and the average credit card rate. The table below is a frequency distribution of the credit card rate charged by the top 100 issuers. Credit Card Rates Credit Card Rate Frequency 18% -23% 19 17% -17.9% 16 16% -16.9% 31 15% -15.9% 26 14% -14.9% Copy Data 8 Step 1 of 2: Calculate the average credit card rate charged by the top 100 issuers based on the frequency distribution. Round your answer to two decimal places.arrow_forwardPlease could you check my answersarrow_forwardLet Y₁, Y2,, Yy be random variables from an Exponential distribution with unknown mean 0. Let Ô be the maximum likelihood estimates for 0. The probability density function of y; is given by P(Yi; 0) = 0, yi≥ 0. The maximum likelihood estimate is given as follows: Select one: = n Σ19 1 Σ19 n-1 Σ19: n² Σ1arrow_forward
- Please could you help me answer parts d and e. Thanksarrow_forwardWhen fitting the model E[Y] = Bo+B1x1,i + B2x2; to a set of n = 25 observations, the following results were obtained using the general linear model notation: and 25 219 10232 551 XTX = 219 10232 3055 133899 133899 6725688, XTY 7361 337051 (XX)-- 0.1132 -0.0044 -0.00008 -0.0044 0.0027 -0.00004 -0.00008 -0.00004 0.00000129, Construct a multiple linear regression model Yin terms of the explanatory variables 1,i, x2,i- a) What is the value of the least squares estimate of the regression coefficient for 1,+? Give your answer correct to 3 decimal places. B1 b) Given that SSR = 5550, and SST=5784. Calculate the value of the MSg correct to 2 decimal places. c) What is the F statistics for this model correct to 2 decimal places?arrow_forwardCalculate the sample mean and sample variance for the following frequency distribution of heart rates for a sample of American adults. If necessary, round to one more decimal place than the largest number of decimal places given in the data. Heart Rates in Beats per Minute Class Frequency 51-58 5 59-66 8 67-74 9 75-82 7 83-90 8arrow_forward
- can someone solvearrow_forwardQUAT6221wA1 Accessibility Mode Immersiv Q.1.2 Match the definition in column X with the correct term in column Y. Two marks will be awarded for each correct answer. (20) COLUMN X Q.1.2.1 COLUMN Y Condenses sample data into a few summary A. Statistics measures Q.1.2.2 The collection of all possible observations that exist for the random variable under study. B. Descriptive statistics Q.1.2.3 Describes a characteristic of a sample. C. Ordinal-scaled data Q.1.2.4 The actual values or outcomes are recorded on a random variable. D. Inferential statistics 0.1.2.5 Categorical data, where the categories have an implied ranking. E. Data Q.1.2.6 A set of mathematically based tools & techniques that transform raw data into F. Statistical modelling information to support effective decision- making. 45 Q Search 28 # 00 8 LO 1 f F10 Prise 11+arrow_forwardStudents - Term 1 - Def X W QUAT6221wA1.docx X C Chat - Learn with Chegg | Cheg X | + w:/r/sites/TertiaryStudents/_layouts/15/Doc.aspx?sourcedoc=%7B2759DFAB-EA5E-4526-9991-9087A973B894% QUAT6221wA1 Accessibility Mode பg Immer The following table indicates the unit prices (in Rands) and quantities of three consumer products to be held in a supermarket warehouse in Lenasia over the time period from April to July 2025. APRIL 2025 JULY 2025 PRODUCT Unit Price (po) Quantity (q0)) Unit Price (p₁) Quantity (q1) Mineral Water R23.70 403 R25.70 423 H&S Shampoo R77.00 922 R79.40 899 Toilet Paper R106.50 725 R104.70 730 The Independent Institute of Education (Pty) Ltd 2025 Q Search L W f Page 7 of 9arrow_forward
 MATLAB: An Introduction with ApplicationsStatisticsISBN:9781119256830Author:Amos GilatPublisher:John Wiley & Sons Inc
 Probability and Statistics for Engineering and th...StatisticsISBN:9781305251809Author:Jay L. DevorePublisher:Cengage Learning
 Statistics for The Behavioral Sciences (MindTap C...StatisticsISBN:9781305504912Author:Frederick J Gravetter, Larry B. WallnauPublisher:Cengage Learning
 Elementary Statistics: Picturing the World (7th E...StatisticsISBN:9780134683416Author:Ron Larson, Betsy FarberPublisher:PEARSON
 The Basic Practice of StatisticsStatisticsISBN:9781319042578Author:David S. Moore, William I. Notz, Michael A. FlignerPublisher:W. H. Freeman
 Introduction to the Practice of StatisticsStatisticsISBN:9781319013387Author:David S. Moore, George P. McCabe, Bruce A. CraigPublisher:W. H. Freeman