
Concept explainers
Videos
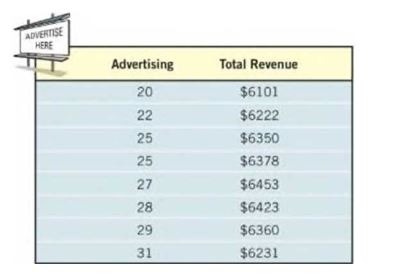
29. Advertising A small manufacturing firm collected the following data on advertising expenditures A (in thousands of dollars) and total revenue R (in thousands of dollars).
(a) Draw a
(b) The quadratic function of best fit to these data is
Use this function to determine the optimal level of advertising.
(c) Use the function to predict the total revenue when the optimal level of advertising is spent.
(d) Use a graphing utility to verify that the function given in part (b) is the quadratic function of best fit.
(e) Use a graphing utility to draw a scatter diagram of the data and then graph the quadratic function of best fit on the scatter diagram.
Want to see the full answer?
Check out a sample textbook solution
Chapter 3 Solutions
Precalculus
Additional Math Textbook Solutions
Pathways To Math Literacy (looseleaf)
APPLIED STAT.IN BUS.+ECONOMICS
A Problem Solving Approach To Mathematics For Elementary School Teachers (13th Edition)
Precalculus: A Unit Circle Approach (3rd Edition)
Elementary & Intermediate Algebra
College Algebra (Collegiate Math)


- Can you help explain what I did based on partial fractions decomposition?arrow_forwardSuppose that a particle moves along a straight line with velocity v (t) = 62t, where 0 < t <3 (v(t) in meters per second, t in seconds). Find the displacement d (t) at time t and the displacement up to t = 3. d(t) ds = ["v (s) da = { The displacement up to t = 3 is d(3)- meters.arrow_forwardLet f (x) = x², a 3, and b = = 4. Answer exactly. a. Find the average value fave of f between a and b. fave b. Find a point c where f (c) = fave. Enter only one of the possible values for c. c=arrow_forward
- please do Q3arrow_forwardUse the properties of logarithms, given that In(2) = 0.6931 and In(3) = 1.0986, to approximate the logarithm. Use a calculator to confirm your approximations. (Round your answers to four decimal places.) (a) In(0.75) (b) In(24) (c) In(18) 1 (d) In ≈ 2 72arrow_forwardFind the indefinite integral. (Remember the constant of integration.) √tan(8x) tan(8x) sec²(8x) dxarrow_forward
- Find the indefinite integral by making a change of variables. (Remember the constant of integration.) √(x+4) 4)√6-x dxarrow_forwarda -> f(x) = f(x) = [x] show that whether f is continuous function or not(by using theorem) Muslim_mathsarrow_forwardUse Green's Theorem to evaluate F. dr, where F = (√+4y, 2x + √√) and C consists of the arc of the curve y = 4x - x² from (0,0) to (4,0) and the line segment from (4,0) to (0,0).arrow_forward
- Evaluate F. dr where F(x, y, z) = (2yz cos(xyz), 2xzcos(xyz), 2xy cos(xyz)) and C is the line π 1 1 segment starting at the point (8, ' and ending at the point (3, 2 3'6arrow_forwardCan you help me find the result of an integral + a 炉[メをメ +炉なarrow_forward2 a Can you help me find the result of an integral a 아 x² dxarrow_forward
 Algebra & Trigonometry with Analytic GeometryAlgebraISBN:9781133382119Author:SwokowskiPublisher:Cengage
 Glencoe Algebra 1, Student Edition, 9780079039897...AlgebraISBN:9780079039897Author:CarterPublisher:McGraw Hill
 Holt Mcdougal Larson Pre-algebra: Student Edition...AlgebraISBN:9780547587776Author:HOLT MCDOUGALPublisher:HOLT MCDOUGAL
 Algebra for College StudentsAlgebraISBN:9781285195780Author:Jerome E. Kaufmann, Karen L. SchwittersPublisher:Cengage Learning