Subpart (a):
Calculate the member of required labor.
Subpart (a):
Explanation of Solution
Number of workers required to produce one unit of goods can be calculated using the following formula.
Substitute the respective values in Equation (1) to calculate the required number of person to produce one unit of car in U.S.
Required labor to produce one unit of car in U.S. is 0.25.
Table 1 illustrates the workers required to produce a car and a ton of grain in the U.S. and the Japan that obtained by using Equation (1).
Table 1
| Workers required to produce | ||
| One Car | One Ton of Grain | |
| U.S. | 0.25 workers | 0.10 workers |
| Japan | 0.25 workers | 0.20 workers |
Concept introduction:
Subpart (b):
Draw the production possibility frontier.
Subpart (b):
Explanation of Solution
Figure 1 shows the productive capacity of two countries.
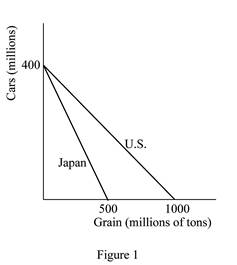
In Figure 1, the horizontal axis measures the quantity of grains produced by both the countries and the vertical axis measures the quantity of cars produced. If either economy, that is, the U.S. or Japan devotes all of its 100 million workers in producing cars each economy can produce 400 million cars in a year
Concept introduction:
Production Possibility Frontier (PPF): PPF refers to the maximum possible combinations of output of goods or services that an economy can attain by efficiently utilizing and employing full resources.
Subpart (c):
Calculate the opportunity cost.
Subpart (c):
Explanation of Solution
Opportunity cost of a car for the U.S. is calculated as follows.
Thus, the opportunity cost of a car for the U.S. is 2.5 tons of grains.
Opportunity cost of a car for Japan is calculated as follows.
Thus, the opportunity cost of a car for Japan is 1.25 tons of grains.
Opportunity cost of producing a ton of grains in the U.S. is calculated as follows
Thus, the opportunity cost of producing a ton of grains in the U.S. is 0.4 units of cars.
Opportunity cost of producing a ton of grains in Japan is calculated as follows.
Thus, the opportunity cost of producing a ton of grains in Japan is 0.8 units of cars.
The results can be tabulated in Table 2 below.
Table 2
| Opportunity Cost | ||
| One Car | One Ton of Grain | |
| U.S. | 2.5 tons of grains | 0.4 units of car |
| Japan | 1.25 tons of grains | 0.8 units of car |
Concept introduction:
Opportunity cost: Opportunity cost is the cost of a foregone alternative, that is, the loss of other alternative when one alternative is chosen.
Subpart (d):
Find the country that has absolute advantage in the production of goods.
Subpart (d):
Explanation of Solution
Neither of these countries has an absolute advantage in producing cars. This is because they are equally productive in the production of a car (4 cars per worker per year). However, in the production of grains, the United States has an absolute advantage because it is more productive than Japan. The U.S. can produce 10 tons of grains per worker per year; whereas Japan can produce only 5 tons of grains per worker per year.
Concept introduction:
Absolute advantage: It is the ability to produce a good using fewer inputs than another producer.
Subpart (e):
Find the country that has absolute advantage in the production of goods.
Subpart (e):
Explanation of Solution
Japan has a
Concept introduction:
Comparative advantage: It refers to the ability to produce a good at a lower opportunity cost than another producer.
Subpart (f):
Calculate the total production before the trade.
Subpart (f):
Explanation of Solution
Without trade and with half the workers in each country producing each of the goods, the United States would produce 200 million cars
Concept introduction:
Trade: The trade refers to the exchange of capital, goods, and services across different countries.
Subpart (g):
Gains from trade for the U.S. and Japan.
Subpart (g):
Explanation of Solution
Firstly, consider the situation without trade in which each country is producing some cars and some grains. Suppose the United States shifts its one worker from producing cars to producing grain, then that worker would produce 4 cars and 10 additional tons of grain. Now suppose, with trade, the United States offers to trade 7 tons of grain to Japan for 4 cars. The United States would encourage this because the cost of producing 4 cars in the United States is 10 tons of grain. So by trading, the United States can gain 4 cars for a cost of only 7 tons of grain. Hence, it is better off by 3 tons of grain.
The same is applicable for Japan, if Japan changes one worker from producing grain to producing cars. That worker would produce 4 more cars and 5 fewer tons of grain. Japan will take the trade because Japan will be better off by 2 tons of grain.
So with the trade and the change of one worker in both the United States and Japan, each country gets the same amount of cars as before but gets additional tons of grain (3 tons of grains for the United States and 2 tons of grains for Japan) making both countries better off.
Concept introduction:
Trade: The trade refers to the exchange of capital, goods, and services across different countries.
Want to see more full solutions like this?
Chapter 3 Solutions
Bundle: Principles of Macroeconomics, Loose-Leaf Version, 7th + Aplia, 1 term Printed Access Card

- C. Regression Discontinuity Birth weight is used as a common sign for a newborn's health. In the United States, if a baby has a birthweight below 1500 grams, the newborn is classified as having “very low birth weight". Suppose you want to study the effect of having very low birth weight on the number of hospital visits made before the baby's first birthday. You decide to use Regression Discontinuity to answer this question. The graph below shows the RD model: Number of hospital visits made before baby's first birthday 5 1400 1450 1500 1550 1600 Birthweight (in grams) a. What is the running variable? (5 points) b. What is the cutoff? (5 points) T What is the discontinuity in the graph and how do you interpret it? (10 points)arrow_forwardExperiments Research suggests that if students use laptops in class, it can have some effect on student achievement. While laptop usage can help students take lecture notes faster, some argue that the laptops may be a source of distraction for the students. Suppose you are interested in looking at the effect of using laptops in class on the students' final exam scores out of 100. You decide to conduct a randomized control trial where you randomly assign some students at UIC to use a laptop in class and other to not use a laptop in class. (Assume that the classes are in person and not online) a. Which people are a part of the treatment group and which people are a part of the control group? (10 points) b. What regression will you run? Define the variables where required. (10 points)arrow_forwardExperiments Research suggests that if students use laptops in class, it can have some effect on student achievement. While laptop usage can help students take lecture notes faster, some argue that the laptops may be a source of distraction for the students. Suppose you are interested in looking at the effect of using laptops in class on the students' final exam scores out of 100. You decide to conduct a randomized control trial where you randomly assign some students at UIC to use a laptop in class and other to not use a laptop in class. (Assume that the classes are in person and not online) a. Which people are a part of the treatment group and which people are a part of the control group? (10 points) b. What regression will you run? Define the variables where required. (10 points)arrow_forward
- Dummy variables News reports claim that in the last year television watching has increased. You believe that rising unemployment during Covid may be one of the causes for this. Suppose you are interested in looking at the effect of being unemployed on the hours spent watching Netflix per day. You collect data on 10,000 people from Chicago who are between the age of 20 and 60. You define the dummy variable Unemployed which takes the value 1 for those who are unemployed and 0 for those who are employed. Equation 1: Hours spent watching Netflix₁ = ßo + B₁Unemployed; + ε¿ Following is the output for equation 1: reg hours spent_watching_netflix unemployed Source SS df MS Number of obs 10,000 F(1, 9998) = 14314.03 Model Residual 3539.70065 2472.39364 9,998 1 3539.70065 .247288822 Prob F R-squared == 0.0000 = 0.5888 Total 6012.09429 9,999 . 601269556 Adj R-squared Root MSE = 0.5887 .49728 hours spen~x Coef. Std. Err. t P>|t| [95% Conf. Interval] unemployed cons 1.189908 .0099456 119.64…arrow_forwardDummy variables News reports claim that in the last year television watching has increased. You believe that rising unemployment during Covid may be one of the causes for this. Suppose you are interested in looking at the effect of being unemployed on the hours spent watching Netflix per day. You collect data on 10,000 people from Chicago who are between the age of 20 and 60. You define the dummy variable Unemployed which takes the value 1 for those who are unemployed and 0 for those who are employed. Equation 1: Hours spent watching Netflix₁ = ßo + B₁Unemployed; + ε¿ Following is the output for equation 1: reg hours spent_watching_netflix unemployed Source SS df MS Number of obs 10,000 F(1, 9998) = 14314.03 Model Residual 3539.70065 2472.39364 9,998 1 3539.70065 .247288822 Prob F R-squared == 0.0000 = 0.5888 Total 6012.09429 9,999 . 601269556 Adj R-squared Root MSE = 0.5887 .49728 hours spen~x Coef. Std. Err. t P>|t| [95% Conf. Interval] unemployed cons 1.189908 .0099456 119.64…arrow_forward17. The South African government's distributive stance is clear given its prioritisation of social spending, which includes grants and subsidised goods. Discuss the advantages and disadvantages of an in-kind subsidy versus a cash grant. Use a graphical illustration to support your arguments. [15] 18. Redistributive expenditure can take the form of direct cash transfers (grants) and/or in-kind subsidies. With references to the graphs below, discuss the merits of these two transfer types in the presence and absence of a positive externality. [14] 19. Expenditure on education and healthcare have, by far, the biggest redistributive effect in South Africa' by one estimate dropping the Gini-coefficient by 10 percentage points. Discuss the South African government's performance in health and education provision by evaluating both the outputs and outcomes in these areas of service delivery. [15] 20. Define the following concepts and provide an example in each case: tax rate structure, general…arrow_forward
- Summarise the case for government intervention in the education marketarrow_forwardShould Maureen question the family about the history of the home? Can Maureen access public records for proof of repairs?arrow_forward3. Distinguish between a direct democracy and a representative democracy. Use appropriate examples to support your answers. [4] 4. Explain the distinction between outputs and outcomes in social service delivery [2] 5. A R1000 tax payable by all adults could be viewed as both a proportional tax and a regressive tax. Do you agree? Explain. [4] 6. Briefly explain the displacement effect in Peacock and Wiseman's model of government expenditure growth and provide a relevant example of it in the South African context. [5] 7. Explain how unbalanced productivity growth may affect government expenditure and briefly comment on its relevance to South Africa. [5] 8. South Africa has recently proposed an increase in its value-added tax rate to 15%, sparking much controversy. Why is it argued that value-added tax is inequitable and what can be done to correct the inequity? [5] 9. Briefly explain the difference between access to education and the quality of education, and why we should care about the…arrow_forward
- 20. Factors 01 pro B. the technological innovations available to companies. A. the laws that regulate manufacturers. C. the resources used to create output D. the waste left over after goods are produced. 21. Table 1.1 shows the tradeoff between different combinations of missile production and home construction, ceteris paribus. Complete the table by calculating the required opportunity costs for both missiles and houses. Then answer the indicated question(s). Combination Number of houses Opportunity cost of houses in Number of missiles terms of missiles J 0 4 K 10,000 3 L 17,000 2 1 M 21,000 0 N 23,000 Opportunity cost of missiles in terms of houses Tutorials-Principles of Economics m health carearrow_forwardIn a small open economy with a floating exchange rate, the supply of real money balances is fixed and a rise in government spending ______ Group of answer choices Raises the interest rate so that net exports must fall to maintain equilibrium in the goods market. Cannot change the interest rate so that net exports must fall to maintain equilibrium in the goods market. Cannot change the interest rate so income must rise to maintain equilibrium in the money market Raises the interest rate, so that income must rise to maintain equilibrium in the money market.arrow_forwardSuppose a country with a fixed exchange rate decides to implement a devaluation of its currency and commits to maintaining the new fixed parity. This implies (A) ______________ in the demand for its goods and a monetary (B) _______________. Group of answer choices (A) expansion ; (B) contraction (A) contraction ; (B) expansion (A) expansion ; (B) expansion (A) contraction ; (B) contractionarrow_forward
 Brief Principles of Macroeconomics (MindTap Cours...EconomicsISBN:9781337091985Author:N. Gregory MankiwPublisher:Cengage Learning
 Essentials of Economics (MindTap Course List)EconomicsISBN:9781337091992Author:N. Gregory MankiwPublisher:Cengage Learning


