
Concept explainers
Videos
The motion picture industry is a competitive business. More than 50 studios produce several hundred new motion pictures each year, and the financial success of the motion pictures varies considerably. The opening weekend gross sales, the total gross sales, the number of
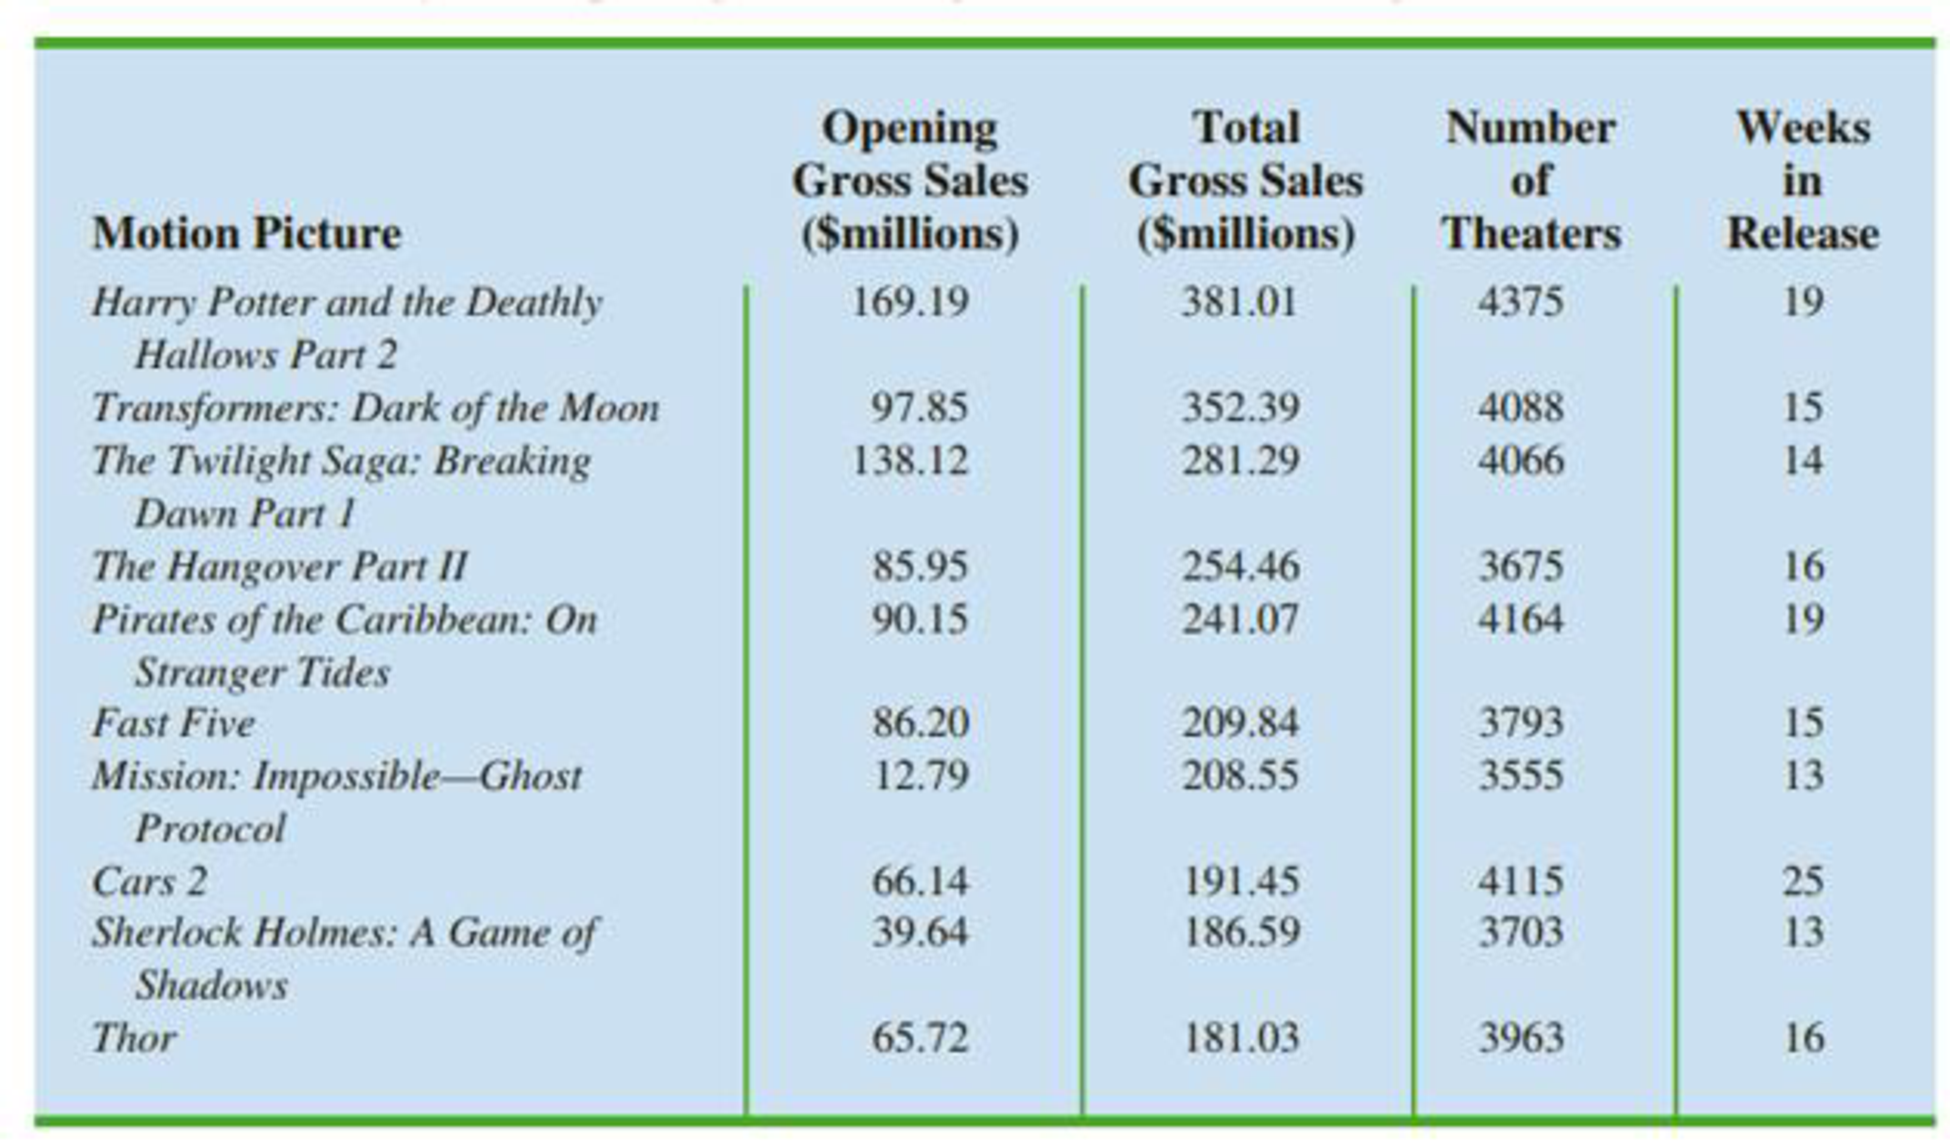
Theaters the movie was shown in, and the number of weeks the motion picture was in release are common variables used to measure the success of a motion picture. Data on the top 100 grossing motion pictures released in 2011 (Box Office Mojo website. March 17, 2012) are contained in the DATA file named 2011Movies. Table 3.10 shows the data for the first 10 motion pictures in this file. Note that some movies, such as War Horse, were released late in 2011 and continued to run in 2012.
Use the numerical methods of
- 1. Descriptive statistics for each of the four variables along with a discussion of what the descriptive statistics tell us about the motion picture industry.
- 2. What motion pictures, if any, should be considered high-performance outliers? Explain.
- 3. Descriptive statistics showing the relationship between total gross sales and each of the other variables. Discuss.
1.
Find the descriptive statistics for each of the four variables along with a discussion of the descriptive statistics to tell about the motion pictures industry.
Answer to Problem 2CP
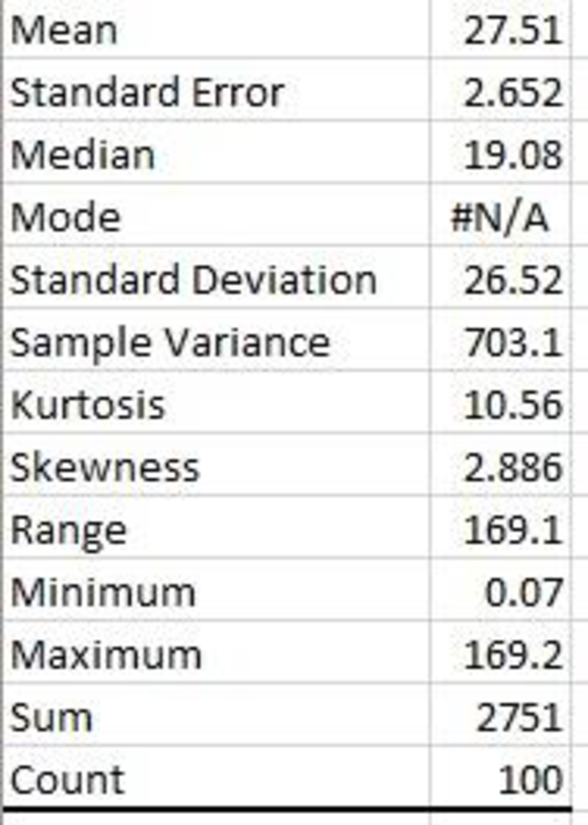
For opening gross sales, the mean is 27.51, the standard deviation is 26.52, the minimum is 0.07, the maximum is 169.2, the first quartile is 12.97, the median is 19.08, and the third quartile is 32.06.
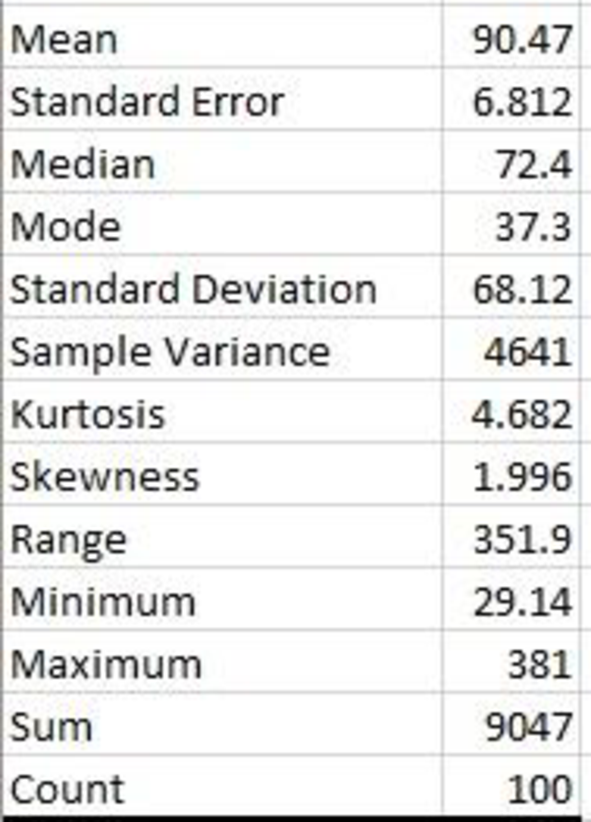
For total gross sales, the mean is 90.47, the standard deviation is 68.12, the minimum is 29.14, the maximum is 381, the first quartile is 39.35, the median is 72.40, and the third quartile is 107.08.
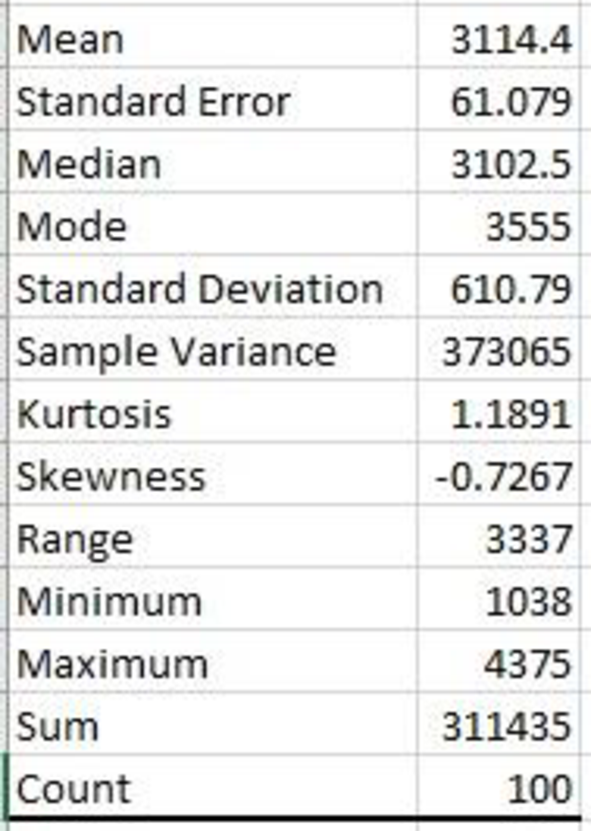
For the number of theatres, the mean is 3,114.4, the standard deviation is 610.79, the minimum is 1,038, the maximum is 4,375, the first quartile is 2,849.25, the median is 3,102.5, and the third quartile is 3,553.25.
For week in release, the mean is 14.58, the standard deviation is 5.049, the minimum is 6, the maximum is 43, the first quartile is 11.250, the median is 14.5, and the third quartile is 17.
Explanation of Solution
Calculation:
The data represent the performance for 10 motion pictures.
For opening Gross Sales:
Software procedure:
Step-by-step procedure to obtain the descriptive statistics using EXCEL:
- In an EXCEL sheet enter the data.
- Go to Data > Data Analysis (in case it is not default, take the Analysis Tool Pak from Excel Add Ins) > Descriptive statistics.
- Enter Input Range as $R$1:$R$100, select Columns in Grouped By, tick on Summary statistics.
- Click on OK.
Output using EXCEL is given as follows:
The first and third quartile for data is to be obtained.
First quartile:
The EXCEL function to compute first quartile is
Software Procedure:
Step-by-step procedure to obtain the first quartile using EXCEL:
- In an EXCEL sheet enter the data values.
- In a cell enter the formula QUARTILE.EXC (R1:R100,1).
- Click on OK.
Output using EXCEL is given as follows:
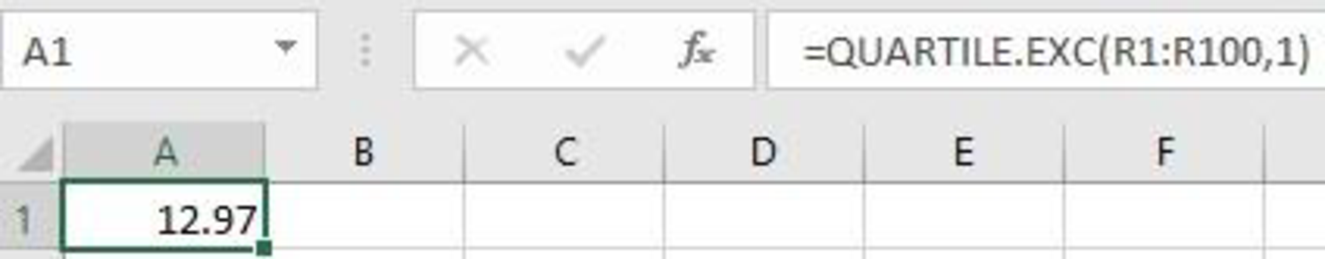
From the EXCEL output, the first quartile is 12.97.
Third quartile:
The EXCEL function to compute third quartile is
Software Procedure:
Step-by-step procedure to obtain the third quartile using EXCEL:
- In an EXCEL sheet enter the data values.
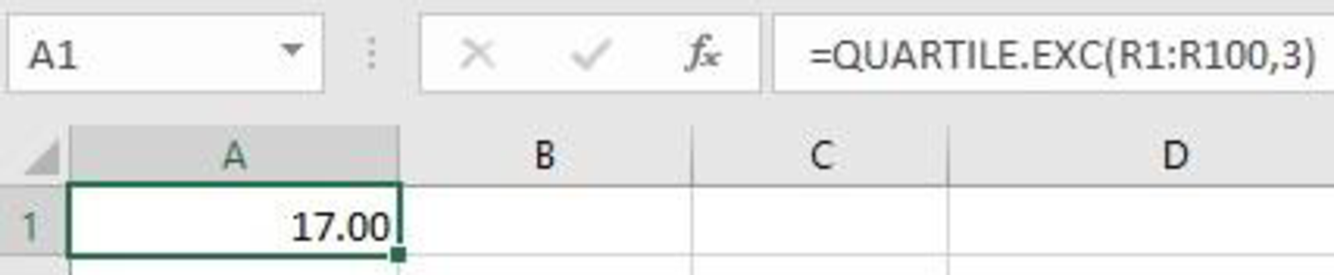
- In a cell enter the formula QUARTILE.EXC (R1:R100,3).
- Click on OK.
Output using EXCEL is given as follows:
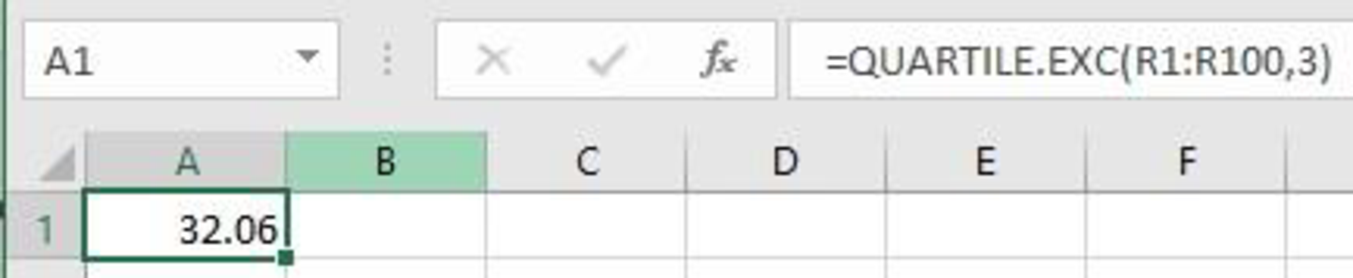
From the EXCEL output, the third quartile is 32.06.
Thus, the first and third quartiles are 12.97 and 32.06, respectively.
Observation:
The mean opening for gross sales is $27.51. The opening weekend gross sales is low as $70,000 and high as $169.19 million. The 50% of the motion pictures has opening gross sales as $19.08 million or less. The 25% of the motion pictures has opening gross sales as $12.97 million or less, and the top 25% of the motion pictures has opening gross sales as $32.06 million or more.
For Total Gross Sales:
Software procedure:
Step-by-step procedure to obtain the descriptive statistics using EXCEL:
- In an EXCEL sheet enter the data.
- Go to Data > Data Analysis (in case it is not default, take the Analysis Tool Pak from Excel Add Ins) > Descriptive statistics.
- Enter Input Range as $R$1:$R$100, select Columns in Grouped By, tick on Summary statistics.
- Click on OK.
Output using EXCEL is given as follows:
The first and third quartile for data is to be obtained.
First quartile:
The EXCEL function to compute first quartile is
Software Procedure:
Step-by-step procedure to obtain the first quartile using EXCEL:
- In an EXCEL sheet enter the data values.
- In a cell enter the formula QUARTILE.EXC (R1:R100,1).
- Click on OK.
Output using EXCEL is given as follows:
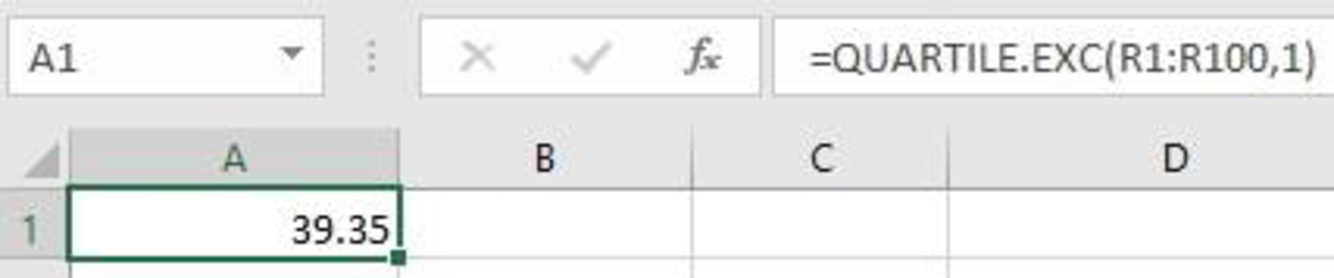
From the EXCEL output, the first quartile is 39.35.
Third quartile:
The EXCEL function to compute third quartile is
Software Procedure:
Step-by-step procedure to obtain the third quartile using EXCEL:
- In an EXCEL sheet enter the data values.
- In a cell enter the formula QUARTILE.EXC (R1:R100,3).
- Click on OK.
Output using EXCEL is given as follows:
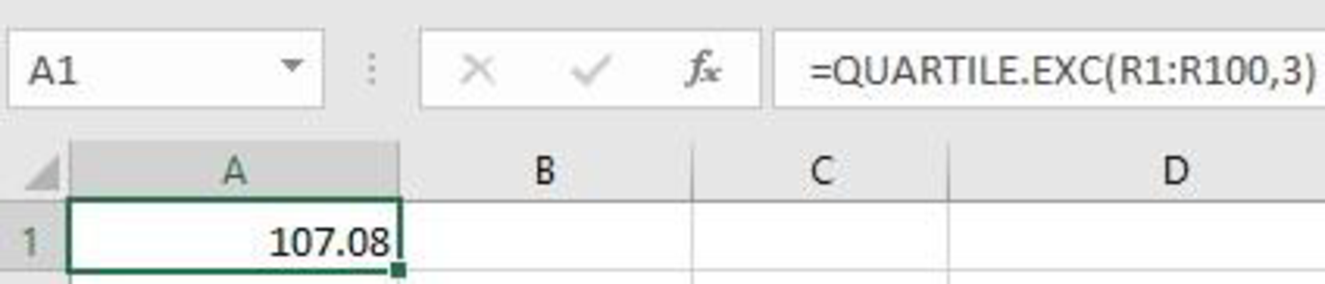
From the EXCEL output, the third quartile is 107.08.
Thus, the first and third quartiles are 39.35 and 107.08, respectively.
Observation:
The mean total gross sales is $90.47. The total gross sales is low as $29.14 million and high as $381 million. The 50% of the motion pictures has total gross sales as $72.40 million or less. The 25% of the motion pictures has total gross sales as $39.35 million or less, and the top 25% of the motion pictures has opening gross sales as $107.08 million or more.
For number of theatres:
Software procedure:
Step-by-step procedure to obtain the descriptive statistics using EXCEL:
- In an EXCEL sheet enter the data.
- Go to Data > Data Analysis (in case it is not default, take the Analysis Tool Pak from Excel Add Ins) > Descriptive statistics.
- Enter Input Range as $R$1:$R$100, select Columns in Grouped By, tick on Summary statistics.
- Click on OK.
Output using EXCEL is given as follows:
The first and third quartile for data is to be obtained.
First quartile:
The EXCEL function to compute first quartile is
Software Procedure:
Step-by-step procedure to obtain the first quartile using EXCEL:
- In an EXCEL sheet enter the data values.
- In a cell enter the formula QUARTILE.EXC (R1:R100,1).
- Click on OK.
Output using EXCEL is given as follows:
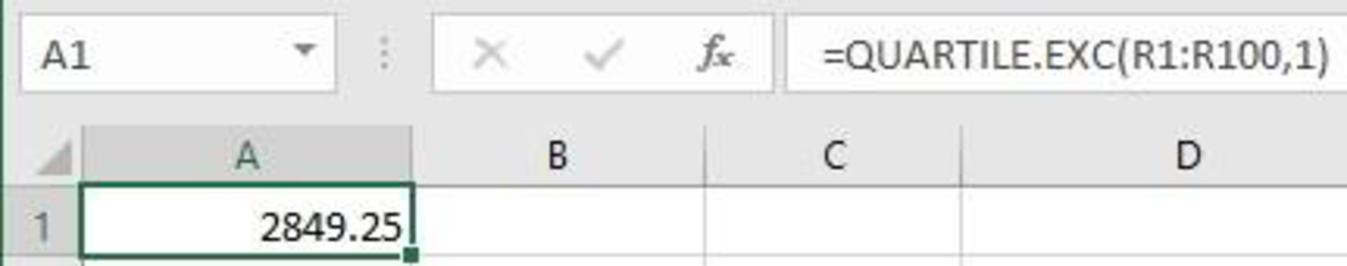
From the EXCEL output, the first quartile is 2,849.25.
Third quartile:
The EXCEL function to compute third quartile is
Software Procedure:
Step-by-step procedure to obtain the third quartile using EXCEL:
- In an EXCEL sheet enter the data values.
- In a cell enter the formula QUARTILE.EXC (R1:R100,3).
- Click on OK.
Output using EXCEL is given as follows:
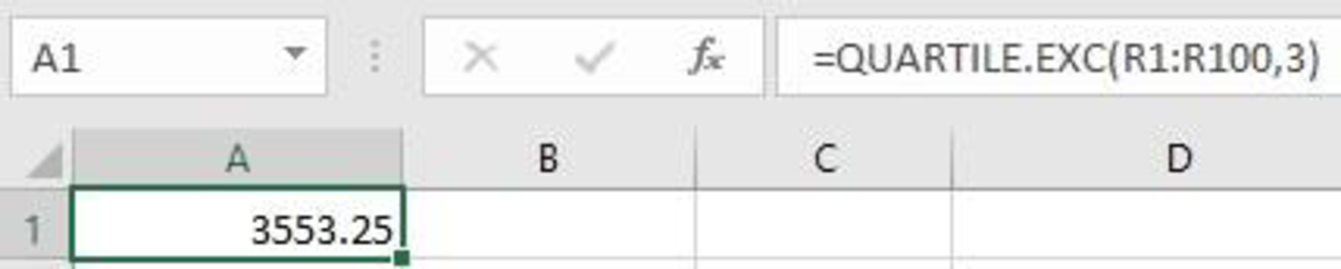
From the EXCEL output, the third quartile is 3,553.25.
Thus, the first and third quartiles are 2,849.25 and 3,553.25, respectively.
Observation:
The mean number of theatres is 3,114.4. The total number of theatres for motion pictures is low as 1,038 theatres and high as 4,375 theatres. The 50% of the motion pictures has been released in 3,102.5 theatres. The 25% of the motion pictures has been released in 2,849.25 theatres or less, and the top 25% of the motion pictures has been released in 3,553.3 theatres or more.
For number of weeks:
Software procedure:
Step-by-step procedure to obtain the descriptive statistics using EXCEL:
- In an EXCEL sheet enter the data.
- Go to Data > Data Analysis (in case it is not default, take the Analysis Tool Pak from Excel Add Ins) > Descriptive statistics.
- Enter Input Range as $R$1:$R$100, select Columns in Grouped By, tick on Summary statistics.
- Click on OK.
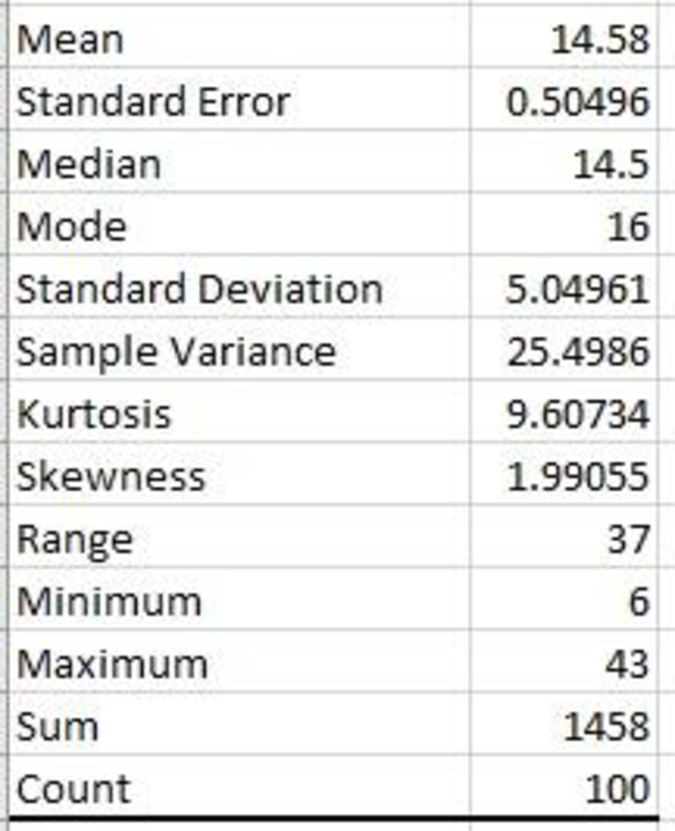
Output using EXCEL is given as follows:
The first and third quartile for data is to be obtained.
First quartile:
The EXCEL function to compute first quartile is
Software Procedure:
Step-by-step procedure to obtain the first quartile using EXCEL:
- In an EXCEL sheet enter the data values.
- In a cell enter the formula QUARTILE.EXC (R1:R100,1).
- Click on OK.
Output using EXCEL is given as follows:
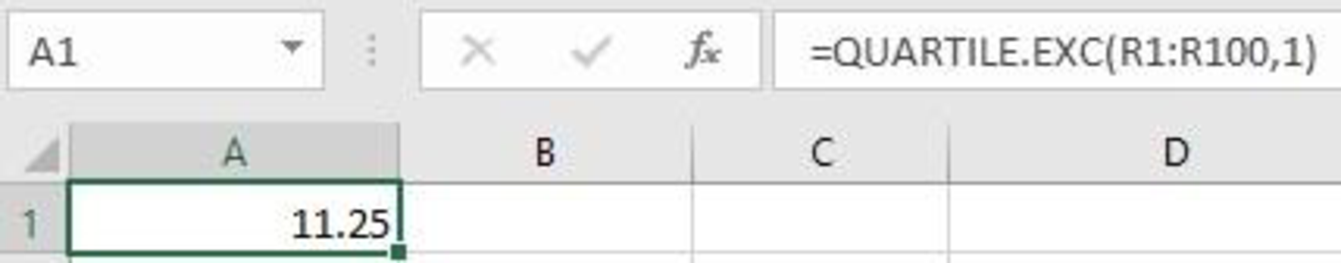
From the EXCEL output, the first quartile is 11.25.
Third quartile:
The EXCEL function to compute third quartile is
Software Procedure:
Step-by-step procedure to obtain the third quartile using EXCEL:
- In an EXCEL sheet enter the data values.
- In a cell enter the formula QUARTILE.EXC (R1:R100,3).
- Click on OK.
Output using EXCEL is given as follows:
From the EXCEL output, the third quartile is 17.
Thus, the first and third quartiles are 11.25 and 17, respectively.
Observation:
The mean number of weeks is 14.58. The total number of weeks for motion pictures to be released in a high volume is low as 6 weeks and high as 43 weeks. The 50% of the motion pictures have been released for 15 weeks or less. The 25% of the motion pictures have been released for 12 weeks or less, and the top 25% of the motion pictures have been released for 17 weeks or more.
b.
Find the motion pictures that should be considered high-performance outliers.
Answer to Problem 2CP
The six pictures have high-openings gross compared with the other motion pictures with more total gross sales. The three motion pictures are released in less number of theatres compared with the other pictures, and the two motion pictures are released for more number of weeks compared with others.
Explanation of Solution
Calculation:
Box plot for Opening Gross Sales:
Software Procedure:
Step-by-step procedure to obtain the Boxplot of Opening Gross Sales using the EXCEL software:
- In an EXCEL sheet enter the data values and select the column of values.
- Choose Insert > Chart > All Charts> Box &Whisker.
- Click on Chart and select Axis Titles from Chart elements.
- Output using the EXCEL software is given below:
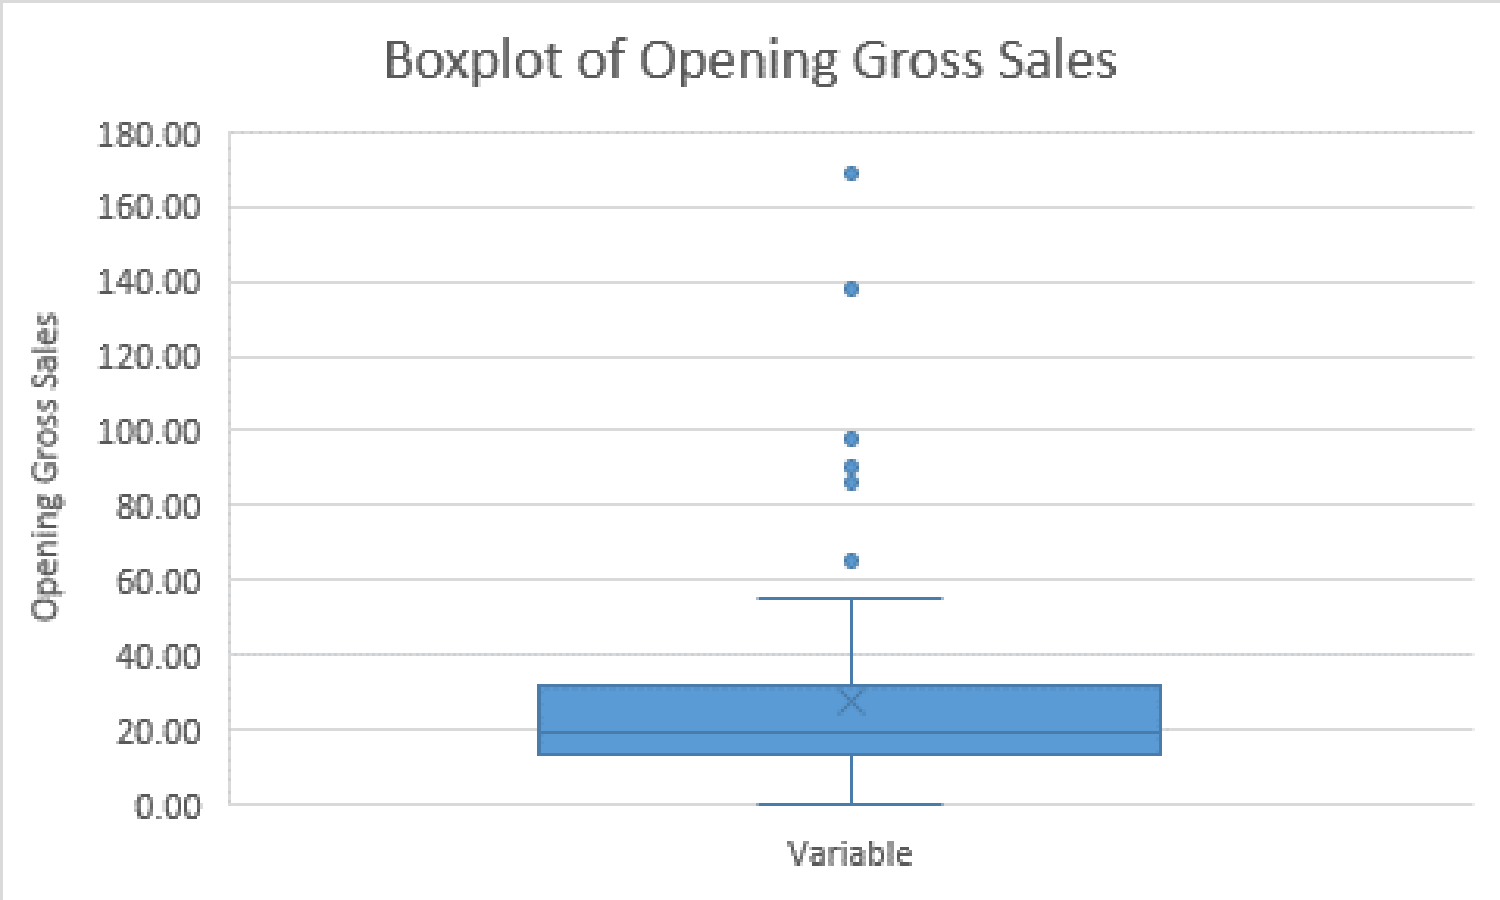
From the box plot, it is clear that the there are six outliers, and these outliers show more opening gross sales compared with the other motion pictures.
Box plot for Total Gross Sales:
Software Procedure:
Step-by-step procedure to obtain the Boxplot of Total Gross Sales using the EXCEL software:
- In an EXCEL sheet enter the data values and select the column of values.
- Choose Insert > Chart > All Charts> Box&Whisker.
- Click on Chart and select Axis Titles from Chart elements.
- Output using the EXCEL software is given below:
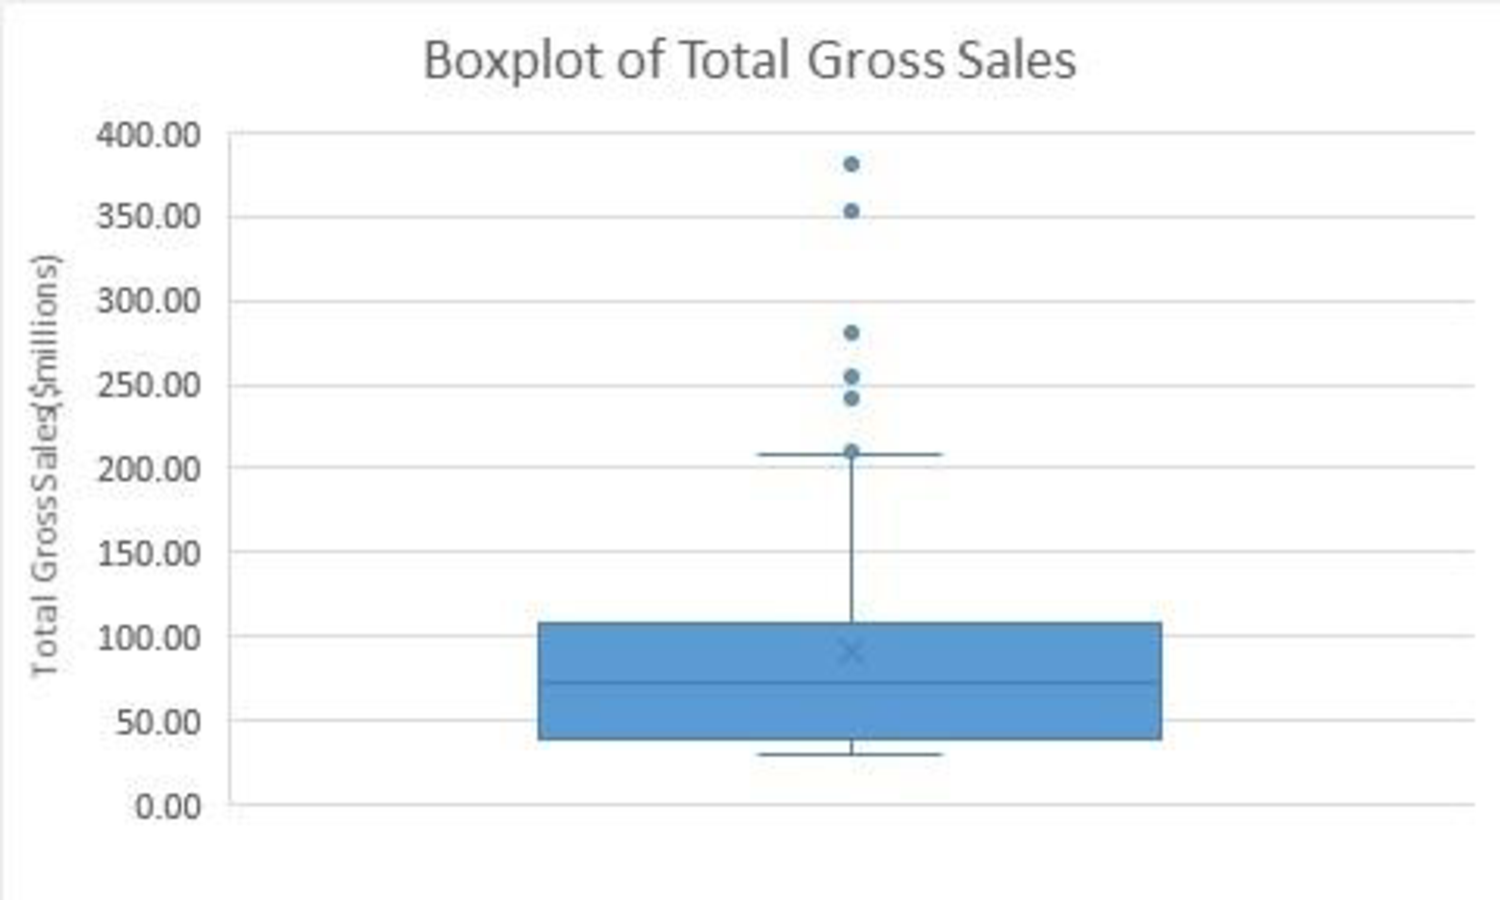
From the box plot, it is clear that there are six outliers, and these outliers show more total gross sales compared with the other motion pictures.
Box plot for number of theatres:
Software Procedure:
Step-by-step procedure to obtain the Boxplot of Number of Theatres using the EXCEL software:
- In an EXCEL sheet enter the data values and select the column of values.
- Choose Insert > Chart > All Charts> Box&Whisker.
- Click on Chart and select Axis Titles from Chart elements.
- Output using the EXCEL software is given below:
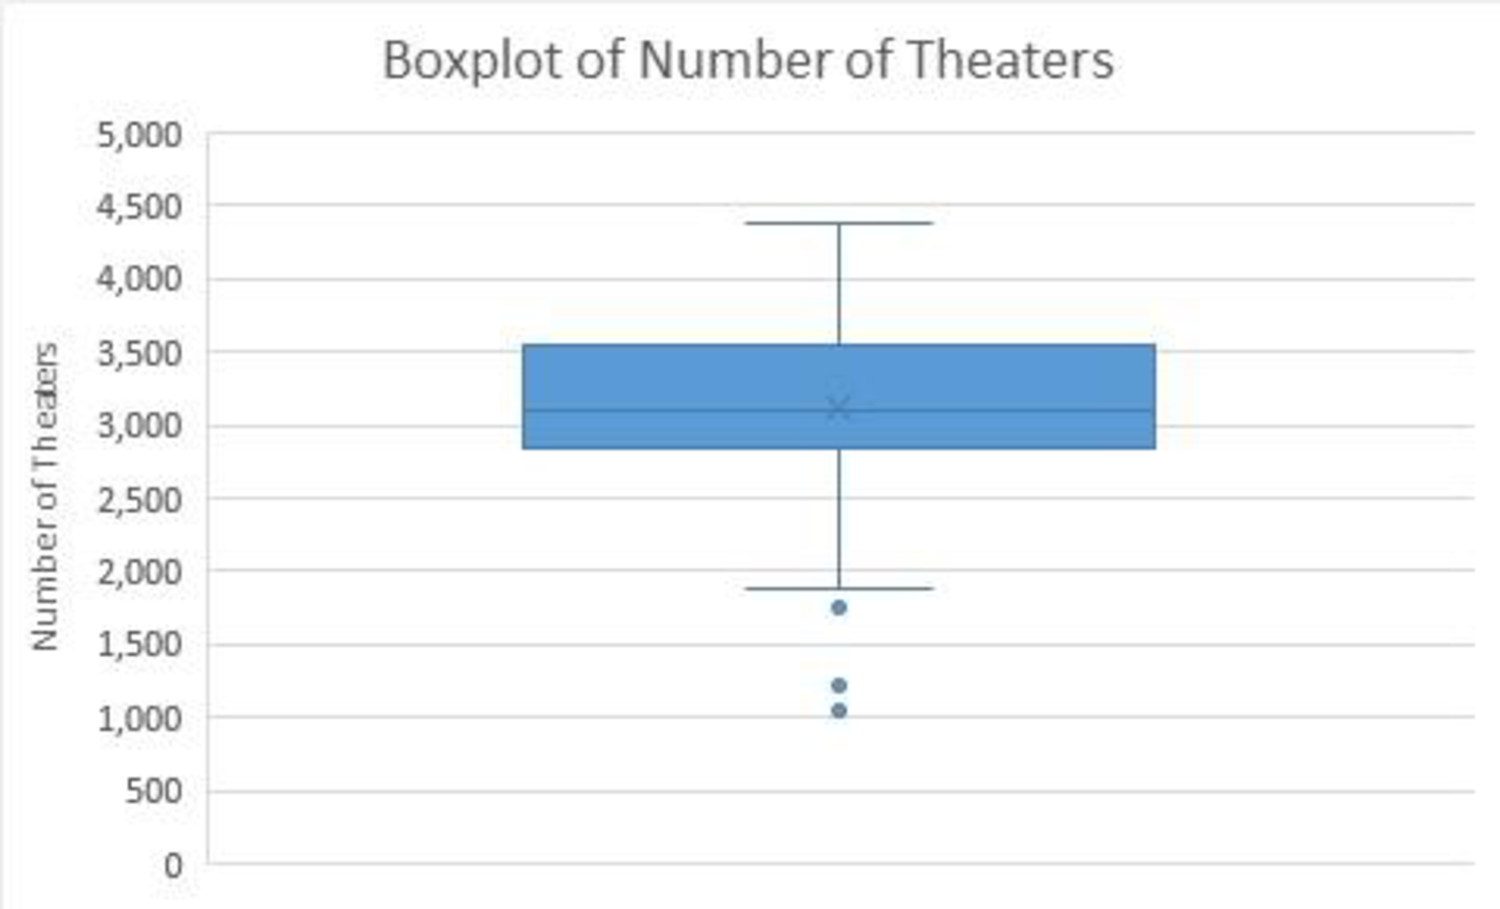
From the box plot, it is clear that there are three outliers, and these outliers show the motion pictures released in less number of theatres compared with the other pictures.
Box plot for number of weeks:
Software Procedure:
Step-by-step procedure to obtain the Boxplot of Weeks in Release using the EXCEL software:
- In an EXCEL sheet enter the data values and select the column of values.
- Choose Insert > Chart > All Charts> Box & Whisker.
- Click on Chart and select Axis Titles from Chart elements.
- Output using the EXCEL software is given below:
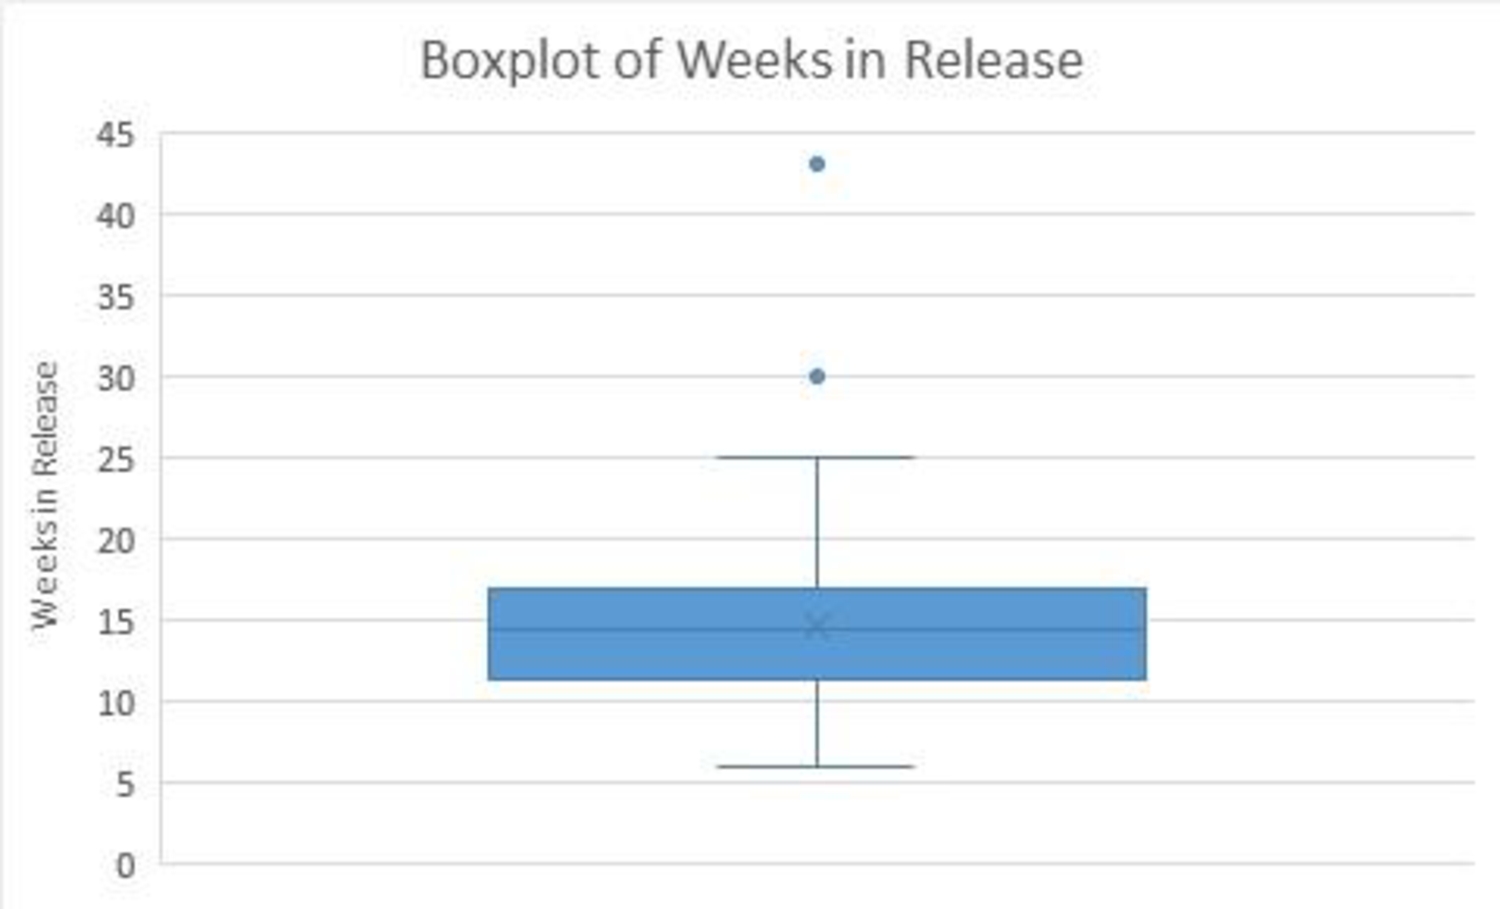
From the box plot, it is clear that there are two outliers, and these outliers show the motion pictures released more number of weeks compared with others.
c.
Find the descriptive statistics that shows the relationship between total gross sales and each of the other variables.
Answer to Problem 2CP
The relationship between total gross sales and each of the other variables is predicted to be positive.
Explanation of Solution
Calculation:
Correlation between Opening Gross Sales and Total Gross Sales:
Software Procedure:
Step-by-step procedure to obtain the correlation coefficient using EXCEL software:
- In an EXCEL sheet enter the data values of Opening Gross Sales in column R and enter the data values of Total Gross Sales in column S.
- In a cell enter the formula =CORREL(R2:R101,S2:S101).
- Click Enter.
Output using EXCEL software is given below:
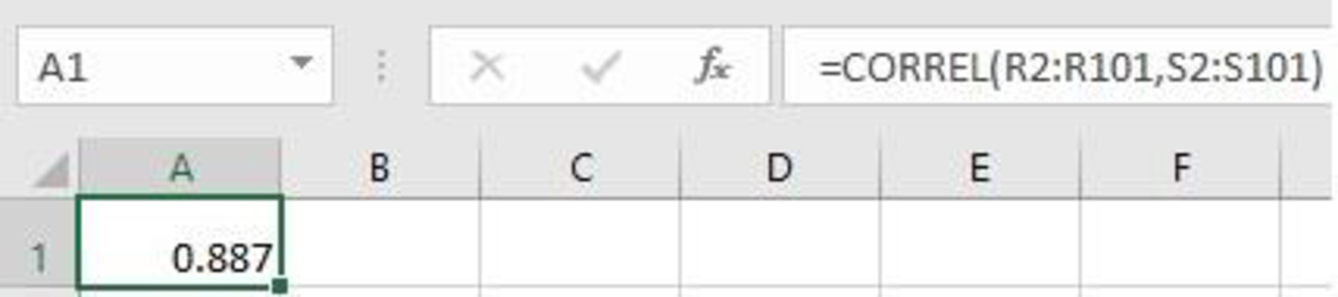
Thus, the sample correlation coefficient between total gross sales and opening gross sales is 0.887.
Correlation between Total Gross Sales and Number of Theatres:
Software Procedure:
Step-by-step procedure to obtain the correlation coefficient using EXCEL software:
- In an EXCEL sheet enter the data values of Total Gross Sales in column S and enter the data values of Number of Theatres in column T.
- In a cell enter the formula =CORREL(S2:S101,T2:T101).
- Click Enter.
Output using EXCEL software is given below:
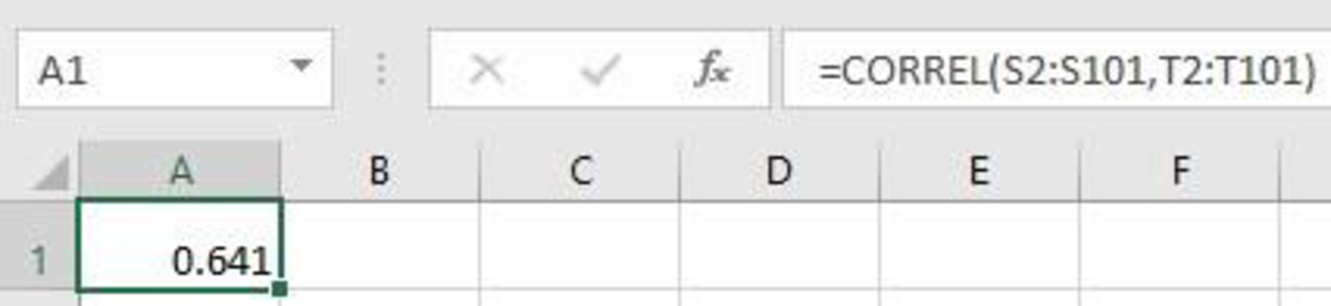
The sample correlation coefficient between total gross sales and number of theatres is 0.641.
Correlation between Total Gross Sales and Weeks in Release:
Software Procedure:
Step-by-step procedure to obtain the correlation coefficient using EXCEL software:
- In an EXCEL sheet enter the data values of Total Gross Sales in column S and enter the data values of Weeks in Release in column U.
- In a cell enter the formula =CORREL(S2:S101,U2:U101).
- Click Enter.
Output using EXCEL software is given below:
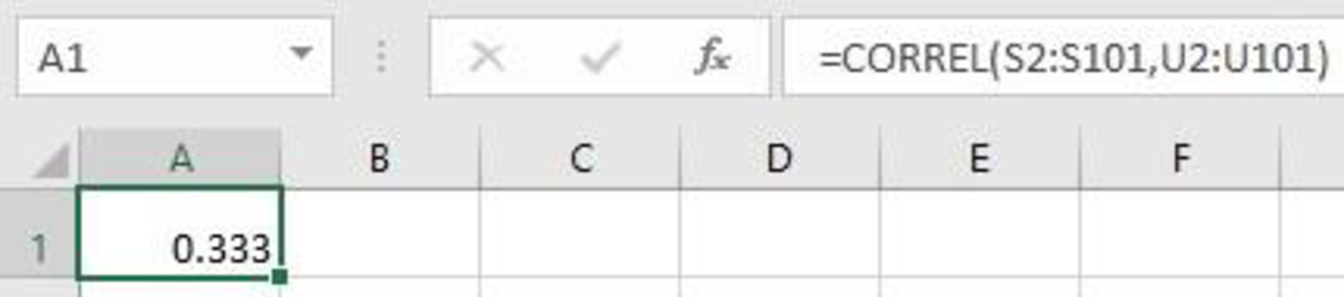
The sample correlation coefficient between total gross sales and weeks in release is 0.333.
Here, the sample correlation coefficient between total gross sales and opening gross sales is 0.887, which is close to 1. Thus, it can be concluded that there exists a strong positive correlation between total gross sales and opening gross sales.
The sample correlation coefficient between total gross sales and number of theatres is 0.641. Thus, it can be concluded that there exists a positive correlation between total gross sales and number of theatres.
The sample correlation coefficient between total gross sales and weeks in release is 0.333. Thus, it can be concluded that there exists a positive correlation between total gross sales and weeks in release.
Want to see more full solutions like this?
Chapter 3 Solutions
Modern Business Statistics with Microsoft Office Excel (with XLSTAT Education Edition Printed Access Card)


- 9. The concentration function of a random variable X is defined as Qx(h) = sup P(x ≤ X ≤x+h), h>0. Show that, if X and Y are independent random variables, then Qx+y (h) min{Qx(h). Qr (h)).arrow_forward10. Prove that, if (t)=1+0(12) as asf->> O is a characteristic function, then p = 1.arrow_forward9. The concentration function of a random variable X is defined as Qx(h) sup P(x ≤x≤x+h), h>0. (b) Is it true that Qx(ah) =aQx (h)?arrow_forward
- 3. Let X1, X2,..., X, be independent, Exp(1)-distributed random variables, and set V₁₁ = max Xk and W₁ = X₁+x+x+ Isk≤narrow_forward7. Consider the function (t)=(1+|t|)e, ER. (a) Prove that is a characteristic function. (b) Prove that the corresponding distribution is absolutely continuous. (c) Prove, departing from itself, that the distribution has finite mean and variance. (d) Prove, without computation, that the mean equals 0. (e) Compute the density.arrow_forward1. Show, by using characteristic, or moment generating functions, that if fx(x) = ½ex, -∞0 < x < ∞, then XY₁ - Y2, where Y₁ and Y2 are independent, exponentially distributed random variables.arrow_forward
- 1. Show, by using characteristic, or moment generating functions, that if 1 fx(x): x) = ½exarrow_forward1990) 02-02 50% mesob berceus +7 What's the probability of getting more than 1 head on 10 flips of a fair coin?arrow_forward9. The concentration function of a random variable X is defined as Qx(h) sup P(x≤x≤x+h), h>0. = x (a) Show that Qx+b(h) = Qx(h).arrow_forward
- Suppose that you buy a lottery ticket, and you have to pick six numbers from 1 through 50 (repetitions allowed). Which combination is more likely to win: 13, 48, 17, 22, 6, 39 or 1, 2, 3, 4, 5, 6? barrow_forward2 Make a histogram from this data set of test scores: 72, 79, 81, 80, 63, 62, 89, 99, 50, 78, 87, 97, 55, 69, 97, 87, 88, 99, 76, 78, 65, 77, 88, 90, and 81. Would a pie chart be appropriate for this data? ganizing Quantitative Data: Charts and Graphs 45arrow_forward10 Meteorologists use computer models to predict when and where a hurricane will hit shore. Suppose they predict that hurricane Stat has a 20 percent chance of hitting the East Coast. a. On what info are the meteorologists basing this prediction? b. Why is this prediction harder to make than your chance of getting a head on your next coin toss? U anoiaarrow_forward
 Glencoe Algebra 1, Student Edition, 9780079039897...AlgebraISBN:9780079039897Author:CarterPublisher:McGraw Hill
 Holt Mcdougal Larson Pre-algebra: Student Edition...AlgebraISBN:9780547587776Author:HOLT MCDOUGALPublisher:HOLT MCDOUGAL
 Algebra: Structure And Method, Book 1AlgebraISBN:9780395977224Author:Richard G. Brown, Mary P. Dolciani, Robert H. Sorgenfrey, William L. ColePublisher:McDougal Littell