
Videos
Two different
a. Compute MAD for each set of forecast, Given your results, which forecast appears to be more accurate? Explain.
b. Compute the MSE for each set of forecasts. Given your results, which forecast appears to be more accurate?
c. In practice, either MAD or MSE would be employed to compute forecast errors. What factors might lead a manager to choose one rather than the other?
d. Compute MAPE for each data set. Which forecast appears to be more accurate?
a)
To compute: Mean Average Deviation (MAD) for each set of forecasts.
Introduction: Mean Absolute Deviation (MAD) is the average distance between the data values and the mean. Mean Squared Error (MSE) is the average of the squares of the deviation and error.
Explanation of Solution
Given information:
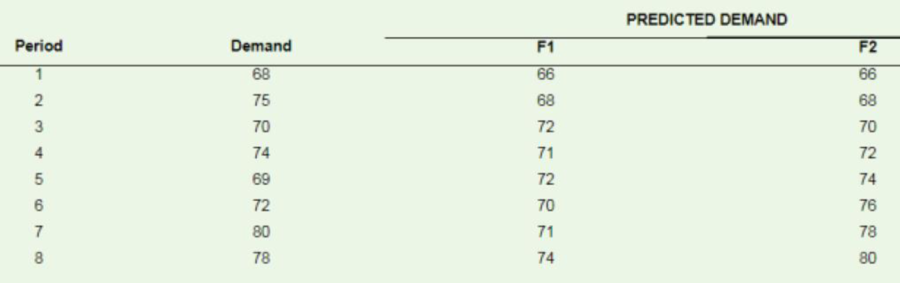
Given the following data on demand and forecasts during two periods, decide which method gives more accurate results, by computing the Mean absolute deviation (MAD) for both the methods as shown below.
Calculate the Mean absolute deviation (MAD) as shown below for the two methods:
Compute the Mean absolute deviation (MAD) for the forecasting method F1 as shown below
Substitute the value of
Compute the Mean absolute deviation (MAD) for the forecasting method F2 as shown below
Substitute the value of
Between the two methods, the second forecasting method F2 has lower MAD and hence more accurate compared to the first method F1
b)
To compute: Mean Squared Error (MSE) for each set of forecasts.
Introduction: Mean Squared Error (MSE) is the average of the squares of the deviation and error.
Explanation of Solution
Given information:
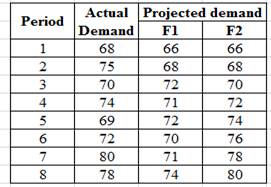
Given the following data on demand and forecasts during two periods, decide which method gives more accurate results, by computing the Mean squared error (MSE) for both the methods as shown below.
Calculate the Mean squared error (MSE) as shown below for the two methods
Compute the Mean squared error (MSE) for the forecasting method F1 as shown below
Substitute the value of
Compute the Mean squared error (MSE) for the forecasting method F2 as shown below
Substitute the value of
Between the two methods, the second forecasting method F2 has lower MSE and hence more accurate compared to the first method F1.
c)
To determine: The factors that lead managers to choose any approach over another.
Introduction: Mean Squared Error (MSE) is the average of the squares of the deviation and error.
Explanation of Solution
MSE magnifies the error by squaring the difference. Therefore, MSE is able to quickly point out wrong forecasting models. However, both MAD and MSE are equally accurate in defining the errors in forecasting. It depends on the individual analyst to choose a particular method for decision making.
d)
To compute: Mean Absolute Percentage Error (MAPE) for each set of forecasts.
Explanation of Solution
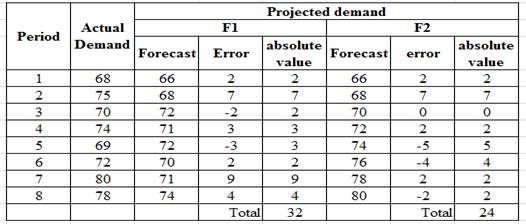
Compute the Mean Absolute Percentage Error (MAPE) as shown below.
The absolute percentage error is computed by dividing the absolute error value by the actual demand figures.
The Mean Absolute Percentage Error (MAPE) is computed by adding the absolute percentage errors for the eight periods and dividing the sum by eight.
The calculations are shown above in the table derived, using Microsoft Excel.
The second forecasting method F2 has a lower MAPE of 4.11% compared to the first forecasting method F1 which gives a MAPE value of 5.34%. Therefore, the second method is more accurate.
Want to see more full solutions like this?
Chapter 3 Solutions
Loose-leaf for Operations Management (The Mcgraw-hill Series in Operations and Decision Sciences)


- qusestion 6. An electrical engineering company is designing two types of solar panel systems: Standard Panels (S) and High-Efficiency Panels (H). The company has certain constraints regarding the hours of labor and material available for production each week. Each Standard Panel requires 4 hours of labor and 2 units of material and each High-Efficiency Panel requires 3 hours of labor and 5 units of material. The company has a maximum of 60 hours of labor and 40 units of material available per week. The profit from each Standard Panel is GH¢80, and the profit from each High-Efficiency Panel is GH¢100. The company wants to determine how many of each type of panel to produce in order to maximize profit. i. Formulate a linear programming model of the problem for the company. ii Convert the linear programming model formulated in (a) to a standard form.arrow_forwardG ווח >>> Mind Tap Cengage Learning 1- CENGAGE MINDTAP Chapter 09 Excel Activity: Exponential Smoothing Question 1 3.33/10 e Submit 自 A ng.cengage.com C Excel Online Student Work G A retail store records customer demand during each sales period. 1. What is the f... Q Search this course ? ✓ Co Excel Online Tutorial Excel Online Activity: Exponential Smoothing A-Z A retail store records customer demand during each sales period. The data has been collected in the Microsoft Excel Online file below. Use the Microsoft Excel Online file below to develop the single exponential smoothing forecast and answer the following questions. Office Video X Open spreadsheet Questions 1. What is the forecast for the 13th period based on the single exponential smoothing? Round your answer to two decimal places. 25.10 2. What is the MSE for the single exponential smoothing forecast? Round your answer to two decimal places. 21.88 Activity Frame ? 3. Choose the correct graph for the single exponential…arrow_forwardNot use ai pleasearrow_forward
- Items removed from the work area (5S) were taken to a storage area called ___________. Choose from: SORT, STORD, KNUJ, STUFF, FUDG SORT STORD KNUJ STUFF FUDGarrow_forwardCould you please help explain How was the poor strategic decisions lead to economic downturns of Circuit City Company? What are the sequences of key events and problems that contribute to its collapse. Could you please explain each one them and give the examples If Circuit City would apply Lean Six Sigma. would it helped prevent businesses from collapsed?? How Qualitative and quantitative Research Methodology in Case Study Research would affect Circuit City?arrow_forwardApple is a global technology company renowned for its innovation and design. To create its products, Apple has established a world class global supply chain to bring their products to market. What strategies is Apple using to source and manufacture its products? How does Apple view its responsibility to its suppliers and those who build its products?arrow_forward
- Critical Path Method (CPM) is an important Project Management Tool that has wide industry application in modern day Project Management. By using an example of the project of your choice, critically examine the practical application of CPM as a Project Management Tool.arrow_forwardwhat is an other difination for principle?arrow_forwardNeed help or ideas to design out two slides as my script and writing quite long to squeese into two slides. But can just point form in slides with correct title and a good script for me to present two slides in only 2.5 mins. Following is my draft, pls guide me step by step on powerpoint creation and good script to present findings. My draft: Slide 1: Foreign Labor Exploitation in Dyson's Supply Chain Introduction Dyson's former Malaysian supplier, ATA IMS Bhd, became embroiled in serious labor exploitation allegations in 2021. These concerns surfaced when whistleblowers exposed unethical labor practices affecting migrant workers, primarily from Nepal and Bangladesh. Key Forms of Exploitation Debt Bondage Due to Recruitment Fees Workers were forced to pay exorbitant recruitment fees before securing employment, often taking loans at high interest rates. This financial burden trapped them in debt bondage, leaving them with little choice but to accept exploitative working…arrow_forward
- Not use ai pleasearrow_forwardThe Business Development Bank of Canada. (2023). Canadian economic outlook for 2024: Shifting into neutral. https://www.bdc.ca/en/articles-tools/blog/canadian-economic-outlook-for-2024-shifting-into-neutral “Despite persistently high inflation and rising interest rates, the news was generally better than expected for the Canadian economy in 2023” (BDC Blog 2024). Discussion Question: In your view, what are the most pressing problems for Canadian companies or consumers in 2024? Explain your answer using current examples of companies or consumer concerns.arrow_forwardhow have idividual objectives led to the current situation at TeraCog? what should Emaa do?arrow_forward
 Contemporary MarketingMarketingISBN:9780357033777Author:Louis E. Boone, David L. KurtzPublisher:Cengage Learning
 MarketingMarketingISBN:9780357033791Author:Pride, William MPublisher:South Western Educational Publishing
 Practical Management ScienceOperations ManagementISBN:9781337406659Author:WINSTON, Wayne L.Publisher:Cengage,
 Purchasing and Supply Chain ManagementOperations ManagementISBN:9781285869681Author:Robert M. Monczka, Robert B. Handfield, Larry C. Giunipero, James L. PattersonPublisher:Cengage Learning