
Concept explainers
Videos
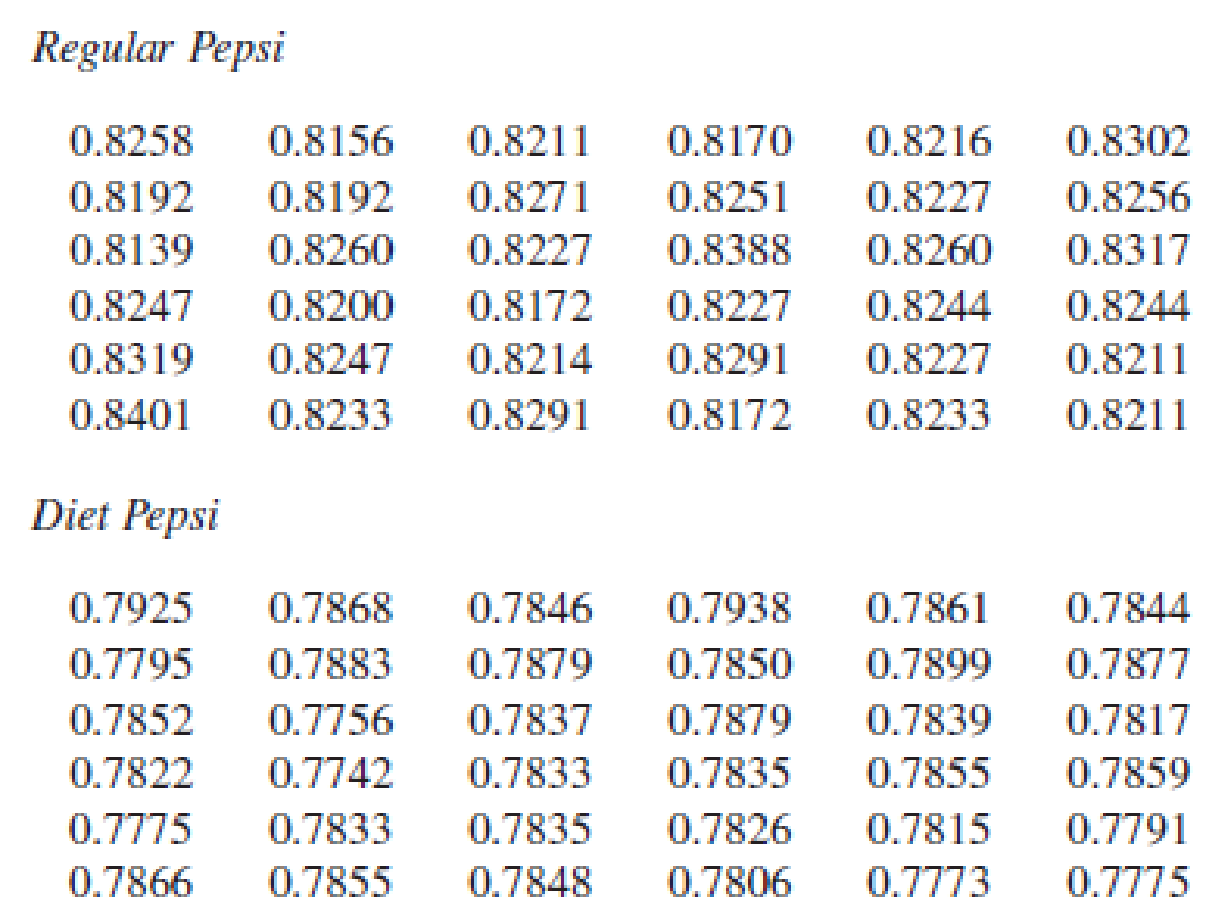
Listed below are measured weights (in pounds) of the contents in samples of cans of regular Pepsi and Diet Pepsi. Use these data for Exercises 1–3
1.
- a. Construct a frequency table for the weights of regular Pepsi. Use these bins:
0.8130–0.8179
0.8180–0.8229
0.8230–0.8279
0.8280–0.8329
0.8330–0.8379
0.8380–0.8429
- b. Construct a frequency table for the weights of Diet Pepsi. Use these bins:
0.7740–0.7779
0.7780–0.7819
0.7820–0.7859
0.7860–0.7899
0.7900–0.7939
- c. Compare the frequency tables from parts (a) and (b). What notable differences are there? How can those notable differences be explained?
a.
Create a frequency table for the weights of regular Pepsi using the given bins.
Answer to Problem 1CRE
The relative frequency table for the weights of regular Pepsi using the given bins is as follows,
| Weights | Frequency |
| 0.8130–0.8179 | 5 |
| 0.8180–0.8229 | 12 |
| 0.8230–0.8279 | 12 |
| 0.8280–0.8329 | 5 |
| 0.8330–0.8379 | 0 |
| 0.8380-0.8429 | 2 |
| Total | 36 |
Explanation of Solution
Calculation
The given information is that,the data represents the weights (in pounds) of the contents in samples of cans of Regular Pepsi and Diet Pepsi.
From the data it is observed that, the values are ranging from 0.8139 to 0.8401. One-way to arrange the data in a group with these bins are classify the weights into different groups. Those are, 0.8130-0.8179, 0.8180-0.8229, 0.8230-0.8279, 0.8280-0.8329, 0.8330-0.8379 and 0.8380-0.8429.
Now, count the frequency for each bin. That is, 5 for bin 0.8130-0.8176 because in that range there are 5 cans and for bin 0.8180-0.8229, 12. Similarly the remaining frequencies are obtained and tabulated below.
The frequency table is as follows,
| Weights | Frequency |
| 0.8130–0.8179 | 5 |
| 0.8180–0.8229 | 12 |
| 0.8230–0.8279 | 12 |
| 0.8280–0.8329 | 5 |
| 0.8330–0.8379 | 0 |
| 0.8380–0.8429 | 2 |
| Total | 36 |
b.
Create a frequency table for the weights of Diet Pepsi.
Answer to Problem 1CRE
The frequency table for the weights of Diet Pepsi is as follows,
| Weights | Frequency |
| 0.7740–0.7779 | 5 |
| 0.7780–0.7819 | 5 |
| 0.7820–0.7859 | 16 |
| 0.7860–0.7899 | 8 |
| 0.7900–0.7939 | 2 |
| Total | 36 |
Explanation of Solution
Calculation
From the data it is observed that, the values are ranging from 0.7742 to 0.7938. The groups for the weights of different bins are 0.7740-0.7779, 0.7780-0.7819, 0.7820-0.7859, 0.7860-0.7899 and 0.7900-0.7939.
Now, count the frequency for each bin. That is, 5 for bin 0.7740-0.7779 because in that range there are 5 cans and for bin 0.7780-0.7819, 5. Similarly the frequencies for remaining bins are obtained and tabulated below.
The frequency table is as follows,
| Weights | Frequency |
| 0.7740–0.7779 | 5 |
| 0.7780–0.7819 | 5 |
| 0.7820–0.7859 | 16 |
| 0.7860–0.7899 | 8 |
| 0.7900–0.7939 | 2 |
| Total | 36 |
c.
Explain whether there are any notable differences by comparing the frequency tables from parts (a) and (b).
Explanation of Solution
From the frequencies tables of parts (a) and (b) it can be observed that, the regular Pepsi weights are more than the diet Pepsi weights because of the sugar levels in the regular Pepsi. But the volumes of both type cans are approximately same.
Want to see more full solutions like this?
Chapter 3 Solutions
Statistical Reasoning for Everyday Life (5th Edition)
Additional Math Textbook Solutions
Pathways To Math Literacy (looseleaf)
Mathematics for the Trades: A Guided Approach (11th Edition) (What's New in Trade Math)
Elementary Statistics: Picturing the World (7th Edition)
Basic College Mathematics


- You want to make a salad from whatever vegetable you have in the fridge. You have seven different tomatoes. There are 2 red tomatoes, 4 yellow tomatoes, and one black tomato in the fridge. You have three different bell peppers. There is 1 red pepper, 1 yellow pepper, and 1 green pepper. What is the probability of randomly choosing a vegetable and getting a red tomato, and a green pepper? Round your answer to four decimal places.arrow_forwarduppose automobile insurance companies gave annual premiums for top-rated companies in several states. The figure below shows box plots for the annual premium for urban customers in three states. Which state offers the lowest premium? Which state offers the highest premium?arrow_forwardWing Foot is a shoe franchise commonly found in shopping centers across the United States. Wing Foot knows that its stores will not show a profit unless they gross over $940,000 per year. Let A be the event that a new Wing Foot store grosses over $940,000 its first year. Let B be the event that a store grosses over $940,000 its second year. Wing Foot has an administrative policy of closing a new store if it does not show a profit in either of the first two years. Assume that the accounting office at Wing Foot provided the following information: 58% of all Wing Foot stores show a profit the first year; 72% of all Wing Foot store show a profit the second year (this includes stores that did not show a profit the first year); however, 86% of Wing Foot stores that showed a profit the first year also showed a profit the second year. Compute P(B|Ac). Round your answer to the nearest hundredth.arrow_forward
- You draw two cards from a standard deck of 52 cards, but before you draw the second card, you put the first one back and reshuffle the deck. If you get a3on the first card, find the probability of drawing a 3 for the second card.arrow_forwardDo bonds reduce the overall risk of an investment portfolio? Let x be a random variable representing annual percent return for the Vanguard Total Stock Index (all Stocks). Let y be a random variable representing annual return for the Vanguard Balanced Index (60% stock and 40% bond). For the past several years, assume the following data. Compute the coefficient of variation for each fund. Round your answers to the nearest tenth. x: 14 0 37 21 35 23 24 -14 -14 -17 y: 8 -2 29 17 22 17 17 -2 -3 -8arrow_forwardWhat percentage of the general U.S. population have bachelor's degrees? Suppose that the Statistical Abstract of the United States, 120th Edition, gives the following percentage of bachelor’s degrees by state. For convenience, the data are sorted in increasing order. 17 18 18 18 19 20 20 20 21 21 21 21 21 22 22 22 22 22 23 23 24 24 24 24 24 25 25 25 25 26 26 26 26 26 26 27 27 27 28 28 28 29 29 31 31 32 32 34 35 38 Illinois has a bachelor's degree percentage rate of about 18%. Into what quartile does this rate fall?arrow_forward
- What percentage of the general U.S. population have bachelor's degrees? Suppose that the Statistical Abstract of the United States, 120th Edition, gives the following percentage of bachelor’s degrees by state. For convenience, the data are sorted in increasing order. 17 18 18 18 19 20 20 20 21 21 21 21 21 22 22 22 22 22 23 23 24 24 24 24 24 25 25 25 25 26 26 26 26 26 26 27 27 27 28 28 28 29 29 31 31 32 32 34 35 38 Illinois has a bachelor's degree percentage rate of about 18%. Into what quartile does this rate fall?arrow_forwardFind the range for the following sample data. x 23 17 11 30 27arrow_forwardDo bonds reduce the overall risk of an investment portfolio? Let x be a random variable representing annual percent return for the Vanguard Total Stock Index (all Stocks). Let y be a random variable representing annual return for the Vanguard Balanced Index (60% stock and 40% bond). For the past several years, assume the following data. Compute the sample mean for x and for y. Round your answer to the nearest tenth. x: 11 0 36 22 34 24 25 -11 -11 -22 y: 9 -3 28 14 23 16 14 -3 -4 -9arrow_forward
- Do bonds reduce the overall risk of an investment portfolio? Let x be a random variable representing annual percent return for the Vanguard Total Stock Index (all Stocks). Let y be a random variable representing annual return for the Vanguard Balanced Index (60% stock and 40% bond). For the past several years, assume the following data. Compute the range for variable y. X 12 0 36 21 35 23 24 -12 -12 -21 Y 10 -2 26 15 22 18 15 -2 -3 -10arrow_forwardDo bonds reduce the overall risk of an investment portfolio? Let x be a random variable representing annual percent return for the Vanguard Total Stock Index (all Stocks). Let y be a random variable representing annual return for the Vanguard Balanced Index (60% stock and 40% bond). For the past several years, assume the following data. Compute the range for variable y. X 12 0 36 21 35 23 24 -12 -12 -21 Y 10 -2 26 15 22 18 15 -2 -3 -10arrow_forwardDo bonds reduce the overall risk of an investment portfolio? Let x be a random variable representing annual percent return for the Vanguard Total Stock Index (all Stocks). Let y be a random variable representing annual return for the Vanguard Balanced Index (60% stock and 40% bond). For the past several years, assume the following data. Compute the range for variable x. X 15 0 37 23 33 25 26 -15 -15 -23 Y 6 -1 28 18 24 17 18 -1 -2 -6arrow_forward
 Holt Mcdougal Larson Pre-algebra: Student Edition...AlgebraISBN:9780547587776Author:HOLT MCDOUGALPublisher:HOLT MCDOUGAL