
Concept explainers
Videos
The motion picture industry is an extremely competitive business. Dozens of movie studios produce hundreds of movies each year, many of which cost hundreds of millions of dollars to produce and distribute. Some of these movies will go on to earn hundreds of millions of dollars in box office revenues, while others will earn much less than their production cost.
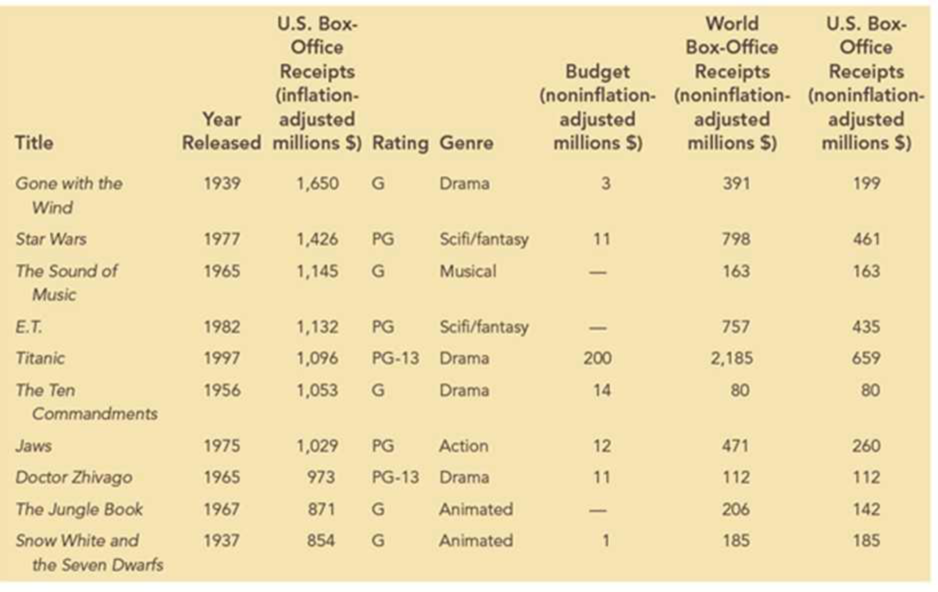
Data from 50 of the top box-office-receipt-generating movies are provided in the file Top50Movies. The following table shows the first 10 movies contained in this data set. The categorical variables included in the data set for each movie are the rating and genre. Quantitative variables for the movie’s release year, inflation- and noninflation-adjusted box-office receipts in the United States, budget, and the world box-office receipts are also included.
Managerial Report
Use the data-visualization methods presented in this chapter to explore these data and discover relationships between the variables. Include the following in your report:
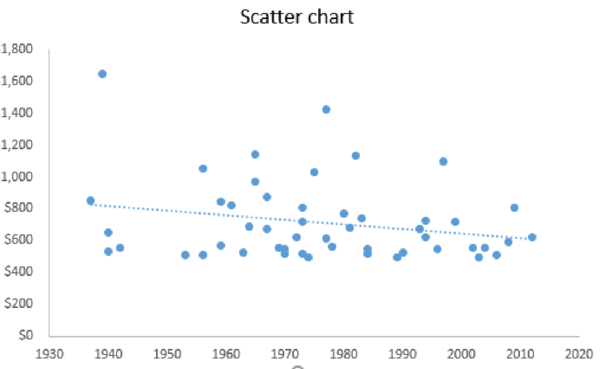
- 1. Create a scatter chart to examine the relationship between the year released and the inflation-adjusted U.S. box office receipts. Include a trendline for this scatter chart. What does the scatter chart indicate about inflation-adjusted U.S. box office receipts over time for these top 50 movies?
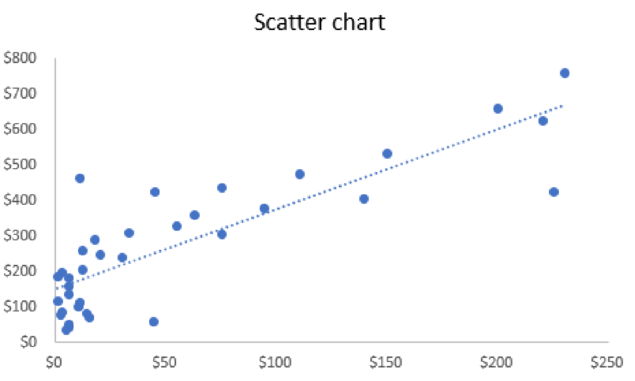
- 2. Create a scatter chart to examine the relationship between the budget and the noninflation-adjusted world box office receipts. (Note: You may have to adjust the data in Excel to ignore the missing budget data values to create your scatter chart. You can do this by first sorting the data using Budget and then creating a scatter chart using only the movies that include data for Budget.) What does this scatter chart indicate about the relationship between the movie’s budget and the world box office receipts?
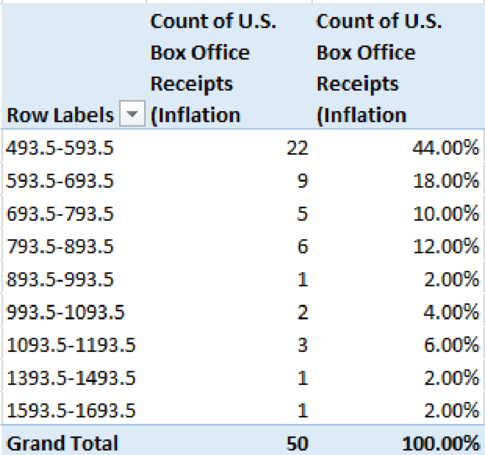
- 3. Create a frequency distribution, percent frequency distribution, and histogram for inflation-adjusted U.S. box office receipts. Use bin sizes of $100 million. Interpret the results. Do any data points appear to be outliers in this distribution?
- 4. Create a PivotTable for these data. Use the PivotTable to generate a crosstabulation for movie genre and rating. Determine which combinations of genre and rating are most represented in the top 50 movie data. Now filter the data to consider only movies released in 1980 or later. What combinations of genre and rating are most represented for movies after 1980? What does this indicate about how the preferences of moviegoers may have changed over time?
- 5. Use the PivotTable to display the average inflation-adjusted U.S. box-office receipts for each genre–rating pair for all movies in the data set. Interpret the results.
1. Give a scatter chart to examine the relationship between the year released and the inflation-adjusted U.S. box office receipts.
2. Give a scatter chart to examine the relationship between the budget and the noninflation-adjusted world box office receipts.
3. Construct a frequency distribution, percent frequency distribution, and histogram for inflation-adjusted U.S. box office receipts. Give interpretation of the results.
4. Construct crosstabulation for movie genre and rating. Find the combinations of genre and rating that are most represented in the top 50 movie data. Find the combinations of genre that are most represented for movies after 1980.
5. Construct the average inflation-adjusted U.S. box-office receipts for genre-rating pair for all movies in the data set using a PivotTable. Give interpretation.
Answer to Problem 1C
1. The scatter chart of the year released and the inflation-adjusted U.S. box office receipts are as follows:
2. The scatter chart to examine the relationship between the budget and the noninflation-adjusted world box office receipts is as follows:
3. The frequency distribution and percent frequency distribution for inflation-adjusted U.S. box office receipts are given below:
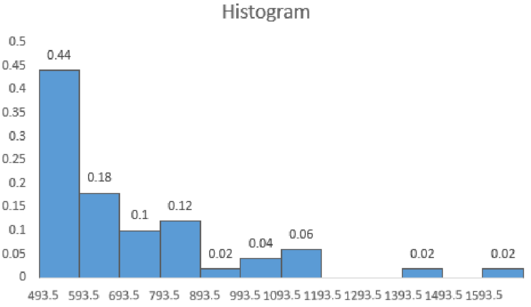
The histogram for inflation-adjusted U.S. box office receipts using an Excel:
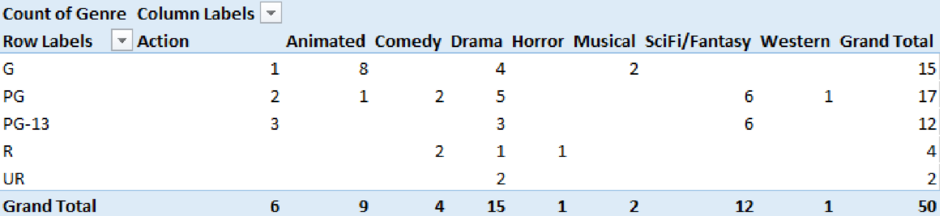
4. The crosstabulation for movie genre and rating for top 50 movies is given below:
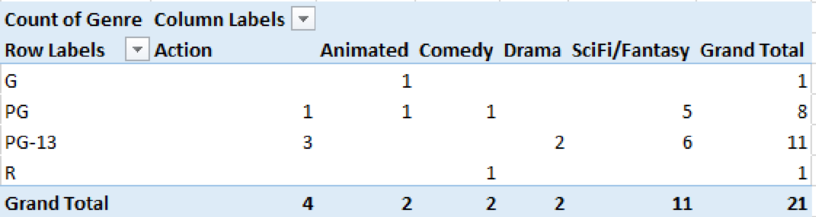
The crosstabulation for movie genre and rating for the movies released after 1980 is as follows:
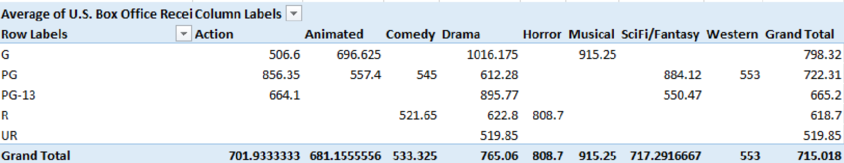
5. The average inflation-adjusted U.S. box-office receipts for genre-rating pair for all movies in the data set is given below:
Explanation of Solution
1.
Step-by-step procedure to obtain the scatter chart of the year released and the inflation-adjusted U.S. box office receipts using an Excel:
- Select the data of Year Released and U.S. Box Office Receipts (Inflation Adjusted Millions $).
- Select Insert.
- Choose Scatter under Charts.
- In Chart Elements, check Trendline.
Thus, the scatter chart of the year released and the inflation-adjusted U.S. box office receipts is obtained.
From the scatter chart, it is clear that there is slight decrease in inflation over years. However, there is no clear linear pattern observed.
2.
Step-by-step procedure to obtain the scatter chart to examine the relationship between the budget and the noninflation-adjusted world box office receipts using an Excel:
- Select the data of Budget (Non-Inflation Adjusted Millions $) and U.S. Box Office Receipts (Non-Inflation Adjusted Millions $).
- Select Insert.
- Choose Scatter under Charts.
- In Chart Elements, check Trendline.
Thus, the scatter chart to examine the relationship between the budget and the noninflation-adjusted world box office receipts is obtained.
From the output, it is clear that as the budget increases, the noninflation-adjusted world box office receipts also increase.
3.
Step-by-step procedure to create frequency distribution and percent frequency distribution for inflation-adjusted U.S. box office receipts using an Excel:
- Select Insert > PivotTable.
- In Select a table or range, select the data of U.S. Box Office Receipts (Inflation Adjusted Millions $) and click OK.
- In PivotTable Fields, move U.S. Box Office Receipts (Inflation Adjusted Millions $) to Rows and Σ Values.
- Right click on a value from Row Labels.
- Enter 100 in By.
- Click on U.S. Box Office Receipts (Inflation Adjusted Millions $) from Σ Values.
- Select Value Field settings.
- In Summarize value field by, choose Count and click OK.
- Again, move U.S. Box Office Receipts (Inflation Adjusted Millions $) to Rows and Σ Values.
- Click on U.S. Box Office Receipts (Inflation Adjusted Millions $) from Σ Values.
- Select Value Field settings.
- In Show Values As, choose % of Grand Total and click OK.
Thus, the frequency distribution and percent frequency distribution are obtained.
Step-by-step procedure to obtain histogram for inflation-adjusted U.S. box office receipts using an Excel:
- Select the data of class interval and percent frequency.
- Select Insert.
- Choose Clustered Column under Charts.
- Click on a bar in the graph.
- In Format Data Series, enter Gap width as 0%.
Thus, the histogram is obtained.
From the distribution table and histogram, it is clear that the frequency for the lowest inflation-adjusted U.S. box office receipts value is the highest. As the value of inflation-adjusted U.S. box office receipts increases, the frequency decreases. The frequency is very low (2%) for the inflation-adjusted U.S. box office receipts value from 1,393 to 1,593.5. This values seem to be outlier.
4.
Step-by-step procedure to obtain crosstabulation for movie genre and rating for top 50 movies using an Excel:
- Select Insert > PivotTable.
- In Select a table or range, select the data of Rating and Genre and click OK.
- In PivotTable Fields, move Rating to Rows, Genre to Columns, and Genre to Σ Values.
- Click on Genre from Σ Values.
- Select Value Field settings.
- In Summarize value field by, choose Count and click OK.
Thus, the crosstabulation for movie genre and rating for top 50 movies is obtained.
From the crosstabulation of movie genre and rating for top 50 movies, it is observed that the combination of G and Animated (=8) is most represented in the top 50 movie data.
Step-by-step procedure to obtain crosstabulation for movie genre and rating for the movies released after 1980 using an Excel:
- Select the data and choose Filter under Sort & Filter.
- Click on the drop-down box in Year Release column.
- Select Number Filters and choose Greater than.
- In Is greater than, enter 1980.
- Select Insert > PivotTable.
- In Select a table or range, select the filtered data of Rating and Genre and click OK.
- In PivotTable Fields, move Rating to Rows, Genre to Columns, and Genre to Σ Values.
- Click on Genre from Σ Values.
- Select Value Field settings.
- In Summarize value field by, choose Count and click OK.
Thus, the crosstabulation for movie genre and rating for the movies released after 1980 is obtained.
From the crosstabulation of movie genre and rating for the movies released after 1980, it is observed that the combination of PG-13 and SciFi/Fantasy (=6) is most represented.
Also, over the time changes, the number of dramas released became reduced. The rating of G and PG becomes high.
5.
Step-by-step procedure to construct the average inflation-adjusted U.S. box-office receipts for genre-rating pair for all movies in the data set using an Excel:
- Select Insert > PivotTable.
- In Select a table or range, select the filtered data of U.S. Box Office Receipts (Inflation Adjusted Millions $), Rating, and Genre and click OK.
- In PivotTable Fields, move Rating to Rows, Genre to Columns, and U.S. Box Office Receipts (Inflation Adjusted Millions $) to Σ Values.
- Click on Genre from Σ Values.
- Select Value Field settings.
- In Summarize value field by, choose Average and click OK.
Thus, the average inflation-adjusted U.S. box-office receipts for genre-rating pair for all movies in the data set is constructed.
From the table, it is clear that the average U.S. box-office receipts are the highest for the genre-rating pair of G and Drama. Also, it is the lowest for G and Action.
Want to see more full solutions like this?
Chapter 3 Solutions
ESSEN OF BUSINESS ANALYTICS (LL) BOM


- 48% of all violent felons in the prison system are repeat offenders. If 40 violent felons are randomly selected, find the probability that a. Exactly 18 of them are repeat offenders. b. At most 18 of them are repeat offenders. c. At least 18 of them are repeat offenders. d. Between 17 and 21 (including 17 and 21) of them are repeat offenders.arrow_forwardConsider an MA(6) model with θ1 = 0.5, θ2 = −25, θ3 = 0.125, θ4 = −0.0625, θ5 = 0.03125, and θ6 = −0.015625. Find a much simpler model that has nearly the same ψ-weights.arrow_forwardLet {Yt} be an AR(2) process of the special form Yt = φ2Yt − 2 + et. Use first principles to find the range of values of φ2 for which the process is stationary.arrow_forward
- Describe the important characteristics of the autocorrelation function for the following models: (a) MA(1), (b) MA(2), (c) AR(1), (d) AR(2), and (e) ARMA(1,1).arrow_forward« CENGAGE MINDTAP Quiz: Chapter 38 Assignment: Quiz: Chapter 38 ips Questions ra1kw08h_ch38.15m 13. 14. 15. O Which sentence has modifiers in the correct place? O a. When called, she for a medical emergency responds quickly. b. Without giving away too much of the plot, Helena described the heroine's actions in the film. O c. Nearly the snakebite victim died before the proper antitoxin was injected. . O O 16 16. O 17. 18. O 19. O 20 20. 21 21. 22. 22 DS 23. 23 24. 25. O O Oarrow_forwardQuestions ra1kw08h_ch36.14m 12. 13. 14. 15. 16. Ӧ 17. 18. 19. OS 20. Two separate sentences need Oa. two separate subjects. Ob. two dependent clauses. c. one shared subject.arrow_forward
- Customers experiencing technical difficulty with their Internet cable service may call an 800 number for technical support. It takes the technician between 30 seconds and 11 minutes to resolve the problem. The distribution of this support time follows the uniform distribution. Required: a. What are the values for a and b in minutes? Note: Do not round your intermediate calculations. Round your answers to 1 decimal place. b-1. What is the mean time to resolve the problem? b-2. What is the standard deviation of the time? c. What percent of the problems take more than 5 minutes to resolve? d. Suppose we wish to find the middle 50% of the problem-solving times. What are the end points of these two times?arrow_forwardExercise 6-6 (Algo) (LO6-3) The director of admissions at Kinzua University in Nova Scotia estimated the distribution of student admissions for the fall semester on the basis of past experience. Admissions Probability 1,100 0.5 1,400 0.4 1,300 0.1 Click here for the Excel Data File Required: What is the expected number of admissions for the fall semester? Compute the variance and the standard deviation of the number of admissions. Note: Round your standard deviation to 2 decimal places.arrow_forward1. Find the mean of the x-values (x-bar) and the mean of the y-values (y-bar) and write/label each here: 2. Label the second row in the table using proper notation; then, complete the table. In the fifth and sixth columns, show the 'products' of what you're multiplying, as well as the answers. X y x minus x-bar y minus y-bar (x minus x-bar)(y minus y-bar) (x minus x-bar)^2 xy 16 20 34 4-2 5 2 3. Write the sums that represents Sxx and Sxy in the table, at the bottom of their respective columns. 4. Find the slope of the Regression line: bi = (simplify your answer) 5. Find the y-intercept of the Regression line, and then write the equation of the Regression line. Show your work. Then, BOX your final answer. Express your line as "y-hat equals...arrow_forward
- Apply STATA commands & submit the output for each question only when indicated below i. Generate the log of birthweight and family income of children. Name these new variables Ibwght & Ifaminc. Include the output of this code. ii. Apply the command sum with the detail option to the variable faminc. Note: you should find the 25th percentile value, the 50th percentile and the 75th percentile value of faminc from the output - you will need it to answer the next question Include the output of this code. iii. iv. Use the output from part ii of this question to Generate a variable called "high_faminc" that takes a value 1 if faminc is less than or equal to the 25th percentile, it takes the value 2 if faminc is greater than 25th percentile but less than or equal to the 50th percentile, it takes the value 3 if faminc is greater than 50th percentile but less than or equal to the 75th percentile, it takes the value 4 if faminc is greater than the 75th percentile. Include the outcome of this code…arrow_forwardsolve this on paperarrow_forwardApply STATA commands & submit the output for each question only when indicated below i. Apply the command egen to create a variable called "wyd" which is the rowtotal function on variables bwght & faminc. ii. Apply the list command for the first 10 observations to show that the code in part i worked. Include the outcome of this code iii. Apply the egen command to create a new variable called "bwghtsum" using the sum function on variable bwght by the variable high_faminc (Note: need to apply the bysort' statement) iv. Apply the "by high_faminc" statement to find the V. descriptive statistics of bwght and bwghtsum Include the output of this code. Why is there a difference between the standard deviations of bwght and bwghtsum from part iv of this question?arrow_forward
 Glencoe Algebra 1, Student Edition, 9780079039897...AlgebraISBN:9780079039897Author:CarterPublisher:McGraw Hill
 Elementary Geometry for College StudentsGeometryISBN:9781285195698Author:Daniel C. Alexander, Geralyn M. KoeberleinPublisher:Cengage Learning
 Holt Mcdougal Larson Pre-algebra: Student Edition...AlgebraISBN:9780547587776Author:HOLT MCDOUGALPublisher:HOLT MCDOUGAL
 Functions and Change: A Modeling Approach to Coll...AlgebraISBN:9781337111348Author:Bruce Crauder, Benny Evans, Alan NoellPublisher:Cengage Learning