
ESSEN OF BUSINESS ANALYTICS (LL) BOM
2nd Edition
ISBN: 9781337128629
Author: Camm
Publisher: CENGAGE L
expand_more
expand_more
format_list_bulleted
Concept explainers
Videos
Textbook Question
Chapter 3, Problem 18P
The Ajax Company uses a portfolio approach to manage their research and development (R&D) projects. Ajax wants to keep a mix of projects to balance the expected return and risk profiles of their R&D activities. Consider a situation in which Ajax has six R&D projects as characterized in the table. Each project is given an expected rate of return and a risk assessment, which is a value between 1 and 10, where 1 is the least risky and 10 is the most risky. Ajax would like to visualize their current R&D projects to keep track of the overall risk and return of their R&D portfolio.
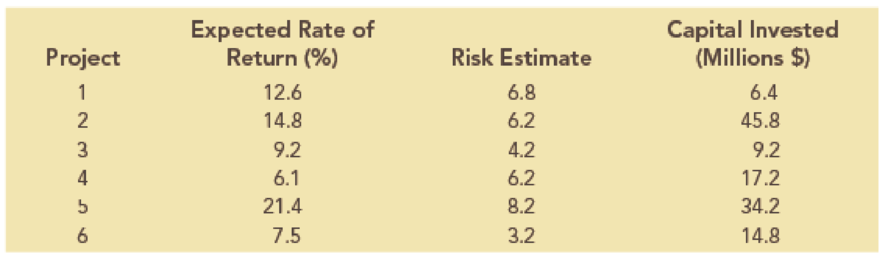
- a. Create a bubble chart in which the expected rate of return is along the horizontal axis, the risk estimate is on the vertical axis, and the size of the bubbles represents the amount of capital invested. Format this chart for best presentation by adding axis labels and labeling each bubble with the project number.
- b. The efficient frontier of R&D projects represents the set of projects that have the highest expected rate of return for a given level of risk. In other words, any project that has a smaller expected rate of return for an equivalent, or higher, risk estimate cannot be on the efficient frontier. From the bubble chart in part a, which projects appear to be located on the efficient frontier?
Expert Solution & Answer

Trending nowThis is a popular solution!

Students have asked these similar questions
Please solving problem2
Problem1
We consider a two-period binomial model with the following properties: each period lastsone (1) year and the current stock price is S0 = 4. On each period, the stock price doubleswhen it moves up and is reduced by half when it moves down. The annual interest rateon the money market is 25%. (This model is the same as in Prob. 1 of HW#2).We consider four options on this market: A European call option with maturity T = 2 years and strike price K = 5; A European put option with maturity T = 2 years and strike price K = 5; An American call option with maturity T = 2 years and strike price K = 5; An American put option with maturity T = 2 years and strike price K = 5.(a) Find the price at time 0 of both European options.(b) Find the price at time 0 of both American options. Compare your results with (a)and comment.(c) For each of the American options, describe the optimal exercising strategy.
Problem 1.We consider a two-period binomial model with the following properties: each period lastsone (1) year and the current stock price is S0 = 4. On each period, the stock price doubleswhen it moves up and is reduced by half when it moves down. The annual interest rateon the money market is 25%.
We consider four options on this market: A European call option with maturity T = 2 years and strike price K = 5; A European put option with maturity T = 2 years and strike price K = 5; An American call option with maturity T = 2 years and strike price K = 5; An American put option with maturity T = 2 years and strike price K = 5.(a) Find the price at time 0 of both European options.(b) Find the price at time 0 of both American options. Compare your results with (a)and comment.(c) For each of the American options, describe the optimal exercising strategy.(d) We assume that you sell the American put to a market participant A for the pricefound in (b). Explain how you act on the market…
What is the standard scores associated to the left of z is 0.1446
Chapter 3 Solutions
ESSEN OF BUSINESS ANALYTICS (LL) BOM
Ch. 3 - A sales manager is trying to determine appropriate...Ch. 3 - The following table shows an example of gross...Ch. 3 - The following table provides monthly revenue...Ch. 3 - In the file MajorSalary, data have been collected...Ch. 3 - Entrepreneur magazine ranks franchises. Among the...Ch. 3 - The file MutualFunds contains a data set with...Ch. 3 - The file TaxData contains information from federal...Ch. 3 - The file FDICBankFailures contains data on...Ch. 3 - The following 20 observations are for two...Ch. 3 - The file Fortune500 contains data for profits and...
Ch. 3 - The International Organization of Motor Vehicle...Ch. 3 - Prob. 12PCh. 3 - Prob. 13PCh. 3 - The total number of term life insurance contracts...Ch. 3 - An automotive company is considering the...Ch. 3 - Consider the following survey results regarding...Ch. 3 - The Northwest regional manager of Logan Outdoor...Ch. 3 - The Ajax Company uses a portfolio approach to...Ch. 3 - Heat maps can be very useful for identifying...Ch. 3 - The following table shows monthly revenue for six...Ch. 3 - Prob. 21PCh. 3 - Aurora Radiological Services is a health care...Ch. 3 - The motion picture industry is an extremely...
Knowledge Booster


Learn more about
Need a deep-dive on the concept behind this application? Look no further. Learn more about this topic, statistics and related others by exploring similar questions and additional content below.Similar questions
- Note: The purpose of this problem below is to use computational techniques (Excelspreadsheet, Matlab, R, Python, etc.) and code the dynamic programming ideas seen inclass. Please provide the numerical answer to the questions as well as a sample of yourwork (spreadsheet, code file, etc.).We consider an N-period binomial model with the following properties: N = 60, thecurrent stock price is S0 = 1000; on each period, the stock price increases by 0.5% whenit moves up and decreases by 0.3% when it moves down. The annual interest rate on themoney market is 5%. (Notice that this model is a CRR model, which means that thebinomial tree is recombining.)(a) Find the price at time t0 = 0 of a (European) call option with strike price K = 1040and maturity T = 1 year.(b) Find the price at time t0 = 0 of a (European) put option with strike price K = 1040and maturity T = 1 year.(c) We consider now, that you are at time t5 (i.e. after 5 periods, which represents 1month later). Assume that the stock…arrow_forwardshow work in paperarrow_forwardshow all work (...or what you entered into your calculator...)arrow_forward
- answerarrow_forwardQuestion 2 The data below provides the battery life of thirty eight (38) motorcycle batteries. 100 83 83 105 110 81 114 99 101 105 78 115 74 96 106 89 94 81 106 91 93 86 79 103 94 108 113 100 117 120 77 93 93 85 76 89 78 88 680 a. Test the hypothesis that mean battery life is greater than 90. Use the 1% level of significance. b. Determine if the mean battery life is different from 80. Use the 10% level of significance. Show all steps for the hypothesis test c. Would your conlcusion in part (b) change at the 5% level of significance? | d. Confirm test results in part (b) using JASP. Note: All JASP input files and output tables should be providedarrow_forwardSuppose that 80% of athletes at a certain college graduate. You randomly select eight athletes. What’s the chance that at most 7 of them graduate?arrow_forward
- Suppose that you flip a fair coin four times. What’s the chance of getting at least one head?arrow_forwardSuppose that the chance that an elementary student eats hot lunch is 30 percent. What’s the chance that, among 20 randomly selected students, between 6 and 8 students eat hot lunch (inclusive)?arrow_forwardBob’s commuting times to work are varied. He makes it to work on time 80 percent of the time. On 12 randomly selected trips to work, what’s the chance that Bob makes it on time at least 10 times?arrow_forward
- Your chance of winning a small prize in a scratch-off ticket is 10 percent. You buy five tickets. What’s the chance you will win at least one prize?arrow_forwardSuppose that 60 percent of families own a pet. You randomly sample four families. What is the chance that two or three of them own a pet?arrow_forwardIf 40 percent of university students purchase their textbooks online, in a random sample of five students, what’s the chance that exactly one of them purchased their textbooks online?arrow_forward
arrow_back_ios
SEE MORE QUESTIONS
arrow_forward_ios
Recommended textbooks for you
 Glencoe Algebra 1, Student Edition, 9780079039897...AlgebraISBN:9780079039897Author:CarterPublisher:McGraw Hill
Glencoe Algebra 1, Student Edition, 9780079039897...
Algebra
ISBN:9780079039897
Author:Carter
Publisher:McGraw Hill
Correlation Vs Regression: Difference Between them with definition & Comparison Chart; Author: Key Differences;https://www.youtube.com/watch?v=Ou2QGSJVd0U;License: Standard YouTube License, CC-BY
Correlation and Regression: Concepts with Illustrative examples; Author: LEARN & APPLY : Lean and Six Sigma;https://www.youtube.com/watch?v=xTpHD5WLuoA;License: Standard YouTube License, CC-BY