Concept explainers
Videos
a.
To calculate: The exponential model for the data.
a.
Answer to Problem 15PS
The exponential model is
Explanation of Solution
Given information:
The population estimates of the American colonies from 1700 to 1780 is provided below,
Calculation:
Consider the population estimates of the American colonies from 1700 to 1780 is provided below,
It is provided that y represent the population in the year t with
Follow the steps provided below to estimate the exponential model.
Step 1: Press
Step 2: Press
Step 3: Enter the column 1 of table provided above in
Step 4: Enter the column 2 of table provided above in
Step 5: Press
Step 6: Press
Step 7: Select the fourth option that is
Step 8: Press
Step 9: Press
The result obtained on screen is provided below.
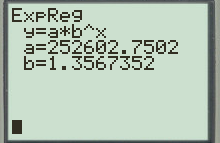
Therefore, exponential model is,
b.
To calculate: The quadratic model for the data.
b.
Answer to Problem 15PS
The quadratic model is
Explanation of Solution
Given information:
The population estimates of the American colonies from 1700 to 1780 is provided below,
Calculation:
Consider the population estimates of the American colonies from 1700 to 1780 is provided below,
It is provided that y represent the population in the year t with
Follow the steps provided below to estimate the quadratic model.
Step 1: Press
Step 2: Press
Step 3: Enter the column 1 of table provided above in
Step 4: Enter the column 2 of table provided above in
Step 5: Press
Step 6: Press
Step 7: Select the fourth option that is
Step 8: Press
Step 9: Press
The result obtained on screen is provided below.
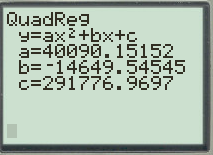
Therefore, quadratic model is,
c.
To graph: The models for the data.
c.
Explanation of Solution
Given information:
The population estimates of the American colonies from 1700 to 1780 is provided below,
Graph:
Consider the population estimates of the American colonies from 1700 to 1780 is provided below,
The exponential model is
The quadratic model is
Plot the data points and all the models in the coordinate plane.
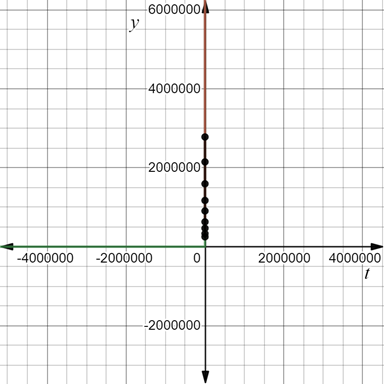
The green curve line represents
Interpretation:
All the models and the data points itself coincide with each other. All the models fits with the data.
d.
To explain: The model that best fits the. Also the model that best fits the data can be used to predict the population of United Sates in 2018.
d.
Answer to Problem 15PS
The model that best fits the data is exponential model. No, this cannot be used to predict the population.
Explanation of Solution
Given information:
The population estimates of the American colonies from 1700 to 1780 is provided below,
Calculation:
Consider the population estimates of the American colonies from 1700 to 1780 is provided below,
The quadratic model is
The exponential model is
From the graphs it is clear that exponential model coincide with actual data points.
Exponential model cannot be used to predict the population as exponential function is increasing function and values obtained would be very high.
There would be a very high growth rate.
Thus, the model that best fits the data is exponential model. No, this cannot be used to predict the population.
Chapter 3 Solutions
EBK PRECALCULUS W/LIMITS


- 6. Solve the system of differential equations using Laplace Transforms: x(t) = 3x₁ (t) + 4x2(t) x(t) = -4x₁(t) + 3x2(t) x₁(0) = 1,x2(0) = 0arrow_forward3. Determine the Laplace Transform for the following functions. Show all of your work: 1-t, 0 ≤t<3 a. e(t) = t2, 3≤t<5 4, t≥ 5 b. f(t) = f(tt)e-3(-) cos 4τ drarrow_forward4. Find the inverse Laplace Transform Show all of your work: a. F(s) = = 2s-3 (s²-10s+61)(5-3) se-2s b. G(s) = (s+2)²arrow_forward
- 1. Consider the differential equation, show all of your work: dy =(y2)(y+1) dx a. Determine the equilibrium solutions for the differential equation. b. Where is the differential equation increasing or decreasing? c. Where are the changes in concavity? d. Suppose that y(0)=0, what is the value of y as t goes to infinity?arrow_forward2. Suppose a LC circuit has the following differential equation: q'+4q=6etcos 4t, q(0) = 1 a. Find the function for q(t), use any method that we have studied in the course. b. What is the transient and the steady-state of the circuit?arrow_forward5. Use variation of parameters to find the general solution to the differential equation: y" - 6y' + 9y=e3x Inxarrow_forward
- Let the region R be the area enclosed by the function f(x) = ln (x) + 2 and g(x) = x. Write an integral in terms of x and also an integral in terms of y that would represent the area of the region R. If necessary, round limit values to the nearest thousandth. 5 4 3 2 1 y x 1 2 3 4arrow_forward(28 points) Define T: [0,1] × [−,0] → R3 by T(y, 0) = (cos 0, y, sin 0). Let S be the half-cylinder surface traced out by T. (a) (4 points) Calculate the normal field for S determined by T.arrow_forward(14 points) Let S = {(x, y, z) | z = e−(x²+y²), x² + y² ≤ 1}. The surface is the graph of ze(+2) sitting over the unit disk. = (a) (4 points) What is the boundary OS? Explain briefly. (b) (4 points) Let F(x, y, z) = (e³+2 - 2y, xe³±² + y, e²+y). Calculate the curl V × F.arrow_forward
- (6 points) Let S be the surface z = 1 − x² - y², x² + y² ≤1. The boundary OS of S is the unit circle x² + y² = 1. Let F(x, y, z) = (x², y², z²). Use the Stokes' Theorem to calculate the line integral Hint: First calculate V x F. Jos F F.ds.arrow_forward(28 points) Define T: [0,1] × [−,0] → R3 by T(y, 0) = (cos 0, y, sin 0). Let S be the half-cylinder surface traced out by T. (a) (4 points) Calculate the normal field for S determined by T.arrow_forwardI need the last answer t=? I did got the answer for the first two this is just homework.arrow_forward
 Calculus: Early TranscendentalsCalculusISBN:9781285741550Author:James StewartPublisher:Cengage Learning
 Thomas' Calculus (14th Edition)CalculusISBN:9780134438986Author:Joel R. Hass, Christopher E. Heil, Maurice D. WeirPublisher:PEARSON
 Calculus: Early Transcendentals (3rd Edition)CalculusISBN:9780134763644Author:William L. Briggs, Lyle Cochran, Bernard Gillett, Eric SchulzPublisher:PEARSON
 Calculus: Early TranscendentalsCalculusISBN:9781319050740Author:Jon Rogawski, Colin Adams, Robert FranzosaPublisher:W. H. Freeman
 Calculus: Early Transcendental FunctionsCalculusISBN:9781337552516Author:Ron Larson, Bruce H. EdwardsPublisher:Cengage Learning