
LL ORG CHEM
6th Edition
ISBN: 9781264840083
Author: SMITH
Publisher: MCG
expand_more
expand_more
format_list_bulleted
Videos
Textbook Question
Chapter 29, Problem 36P
Draw three-dimensional structures f or each alcohol. Label the
a. 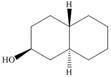 b.
b. 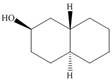 c.
c. 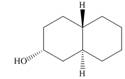 d.
d. 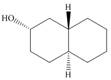
Expert Solution & Answer
Want to see the full answer?
Check out a sample textbook solution
Students have asked these similar questions
pressure (atm)
3
The pressure on a sample of pure X held at 47. °C and 0.88 atm is increased until the sample condenses. The pressure is then held constant and the
temperature is decreased by 82. °C. On the phase diagram below draw a path that shows this set of changes.
0
0
200
temperature (K)
400
а
er your payment details | bar xb Home | bartleby
x +
aleksogi/x/isl.exe/1o u-lgNskr7j8P3jH-1Qs_pBanHhviTCeeBZbufuBYT0Hz7m7D3ZcW81NC1d8Kzb4srFik1OUFhKMUXzhGpw7k1
O States of Matter
Sketching a described thermodynamic change on a phase diagram
0/5
The pressure on a sample of pure X held at 47. °C and 0.88 atm is increased until the sample condenses. The pressure is then held constant and the
temperature is decreased by 82. °C. On the phase diagram below draw a path that shows this set of changes.
pressure (atm)
1
3-
0-
0
200
Explanation
Check
temperature (K)
400
X
Q Search
L
G
2025 McGraw Hill LLC. All Rights Reserved Terms of Use Privacy Ce
5.
Chapter 29 Solutions
LL ORG CHEM
Ch. 29.2 - Problem 31.1
One component of jojoba oil is a wax...Ch. 29.3 - Problem 31.2
How would you expect the melting...Ch. 29.3 - Problem 31.3
Draw the products formed when...Ch. 29.3 - Problem 31.4
The main fatty acid component of the...Ch. 29.3 - Prob. 5PCh. 29.7 - Problem 31.10
Locate the isoprene units in each...Ch. 29.7 - Problem 31.11
Locate the isoprene units in...Ch. 29.7 - Problem 31.12
Write a stepwise mechanism for the...Ch. 29.7 - Prob. 14PCh. 29.8 - Prob. 15P
Ch. 29.8 - Prob. 16PCh. 29.8 - Prob. 17PCh. 29 - 31.17 Locate the isoprene units in each...Ch. 29 - Prob. 25PCh. 29 - Locate the isoprene units in each compound. a. e....Ch. 29 - 31.27 Classify each terpene and terpenoid in...Ch. 29 - Prob. 33PCh. 29 - Draw three-dimensional structures f or each...Ch. 29 - Prob. 37PCh. 29 - Prob. 38PCh. 29 - Prob. 39PCh. 29 - Prob. 40PCh. 29 - 31.38 Draw the products formed when cholesterol is...Ch. 29 - 31.39 Draw a stepwise mechanism for the following...Ch. 29 - 31.40 Draw a stepwise mechanism for the following...Ch. 29 - Prob. 44P
Knowledge Booster


Learn more about
Need a deep-dive on the concept behind this application? Look no further. Learn more about this topic, chemistry and related others by exploring similar questions and additional content below.Similar questions
- 6.arrow_forward0/5 alekscgi/x/sl.exe/1o_u-IgNglkr7j8P3jH-IQs_pBaHhvlTCeeBZbufuBYTi0Hz7m7D3ZcSLEFovsXaorzoFtUs | AbtAURtkqzol 1HRAS286, O States of Matter Sketching a described thermodynamic change on a phase diagram The pressure on a sample of pure X held at 47. °C and 0.88 atm is increased until the sample condenses. The pressure is then held constant and the temperature is decreased by 82. °C. On the phase diagram below draw a path that shows this set of changes. 3 pressure (atm) + 0- 0 5+ 200 temperature (K) 400 Explanation Check X 0+ F3 F4 F5 F6 F7 S 2025 McGraw Hill LLC All Rights Reserved. Terms of Use Privacy Center Accessibility Q Search LUCR + F8 F9 F10 F11 F12 * % & ( 5 6 7 8 9 Y'S Dele Insert PrtSc + Backsarrow_forward5.arrow_forward
- 9arrow_forwardalekscgi/x/lsl.exe/1o_u-IgNslkr7j8P3jH-IQs_pBanHhvlTCeeBZbufu BYTI0Hz7m7D3ZS18w-nDB10538ZsAtmorZoFusYj2Xu9b78gZo- O States of Matter Sketching a described thermodynamic change on a phase diagram 0/5 The pressure on a sample of pure X held at 47. °C and 0.88 atm is increased until the sample condenses. The pressure is then held constant and the temperature is decreased by 82. °C. On the phase diagram below draw a path that shows this set of changes. pressure (atm) 3- 200 temperature (K) Explanation Chick Q Sowncharrow_forward0+ aleksog/x/lsl.exe/1ou-lgNgkr7j8P3H-IQs pBaHhviTCeeBZbufuBYTOHz7m7D3ZStEPTBSB3u9bsp3Da pl19qomOXLhvWbH9wmXW5zm O States of Matter Sketching a described thermodynamic change on a phase diagram 0/5 Gab The temperature on a sample of pure X held at 0.75 atm and -229. °C is increased until the sample sublimes. The temperature is then held constant and the pressure is decreased by 0.50 atm. On the phase diagram below draw a path that shows this set of changes. F3 pressure (atm) 0- 0 200 Explanation temperature (K) Check F4 F5 ☀+ Q Search Chill Will an 9 ENG F6 F7 F8 F9 8 Delete F10 F11 F12 Insert PrtSc 114 d Ararrow_forward
- x + LEKS: Using a phase diagram a X n/alekscgi/x/lsl.exe/10_u-IgNsikr7j8P3jH-IQs_pBan HhvlTCeeBZbufu BYTI0Hz7m7D3ZcHYUt80XL-5alyVpw ○ States of Matter Using a phase diagram to find a phase transition temperature or pressure Use the phase diagram of Substance X below to find the melting point of X when the pressure above the solid is 1.1 atm. pressure (atm) 16 08- solid liquid- 0 200 400 gas 600 temperature (K) Note: your answer must be within 25 °C of the exact answer to be graded correct. × 5arrow_forwardS: Using a phase diagram leksogi/x/sl.exe/1ou-IgNs kr 7j8P3jH-IQs_pBan HhvTCeeBZbufuBYTI0Hz7m7D3ZdHYU+80XL-5alyVp O States of Matter Using a phase diagram to find a phase transition temperature or pressure se the phase diagram of Substance X below to find the boiling point of X when the pressure on the liquid is 1.6 atm. pressure (atm) 32- 16- solid liquid 0. gas 100 200 temperature (K) 300 Note: your answer must be within 12.5 °C of the exact answer to be graded correct. 10 Explanation Check § Q Search J 2025 McGraw Hill LLC. All Rights Researrow_forward151.2 254.8 85.9 199.6 241.4 87.6 242.5 186.4 155.8 257.1 242.9 253.3 256.0 216.6 108.7 239.0 149.7 236.4 152.1 222.7 148.7 278.2 268.7 234.4 262.7 283.2 143.6 QUESTION: Using this group of data on salt reduced tomato sauce concentration readings answer the following questions: 1. 95% Cl Confidence Interval (mmol/L) 2. [Na+] (mg/100 mL) 3. 95% Na+ Confidence Interval (mg/100 mL)arrow_forward
- Results Search Results Best Free Coursehero Unloc xb Success Confirmation of Q x O Google Pas alekscgi/x/lsl.exe/1o_u-IgNslkr 7j8P3jH-IQs_pBanHhvlTCeeBZbufu BYTI0Hz7m7D3ZcHYUt80XL-5alyVpwDXM TEZayFYCavJ17dZtpxbFD0Qggd1J O States of Matter Using a phase diagram to find a phase transition temperature or pressure Gabr 3/5 he pressure above a pure sample of solid Substance X at 101. °C is lowered. At what pressure will the sample sublime? Use the phase diagram of X below to nd your answer. pressure (atm) 24- 12 solid liquid gas 200 400 temperature (K) 600 ote: your answer must be within 0.15 atm of the exact answer to be graded correct. atm Thanation Check © 2025 McGraw Hill LLC. All Rights Reserved. Terms of Use | Privacy Center I Q Search L³ ملةarrow_forward301.7 348.9 193.7 308.6 339.5 160.6 337.7 464.7 223.5 370.5 326.6 327.5 336.1 317.9 203.8 329.8 221.9 331.7 211.7 309.6 223.4 353.7 334.6 305.6 340.0 304.3 244.7 QUESTION: Using this group of data on regular tomato sauce concentration readings answer the following questions: 1. 95% Cl Confidence Interval (mmol/L) 2. [Na+] (mg/100 mL) 3. 95% Na+ Confidence Interval (mg/100 mL)arrow_forwardSearch Results Search Results Best Free Coursehero Unlo x b Success Confirmation of Q aleks.com/alekscgi/x/sl.exe/10_u-lgNslkr7j8P3jH-IQs_pBan HhvlTCeeBZbufu BYTIOHz7m7D3ZcHYUt80XL-5alyVpwDXM TEZayFYCav States of Matter Using a phase diagram to find a phase transition temperature or pressure Use the phase diagram of Substance X below to find the temperature at which X turns to a gas, if the pressure above the solid is 3.7 atm. pressure (atm) 0. 32- 16 solid liquid gas 200 temperature (K) Note: your answer must be within 20 °C of the exact answer to be graded correct. Дос Xarrow_forward
arrow_back_ios
SEE MORE QUESTIONS
arrow_forward_ios
Recommended textbooks for you
 Chemistry for Today: General, Organic, and Bioche...ChemistryISBN:9781305960060Author:Spencer L. Seager, Michael R. Slabaugh, Maren S. HansenPublisher:Cengage Learning
 Organic ChemistryChemistryISBN:9781305580350Author:William H. Brown, Brent L. Iverson, Eric Anslyn, Christopher S. FootePublisher:Cengage Learning
 Introductory Chemistry: An Active Learning Approa...ChemistryISBN:9781305079250Author:Mark S. Cracolice, Ed PetersPublisher:Cengage Learning
 Chemistry: Principles and PracticeChemistryISBN:9780534420123Author:Daniel L. Reger, Scott R. Goode, David W. Ball, Edward MercerPublisher:Cengage Learning
 Organic Chemistry: A Guided InquiryChemistryISBN:9780618974122Author:Andrei StraumanisPublisher:Cengage Learning
Chemistry for Today: General, Organic, and Bioche...
Chemistry
ISBN:9781305960060
Author:Spencer L. Seager, Michael R. Slabaugh, Maren S. Hansen
Publisher:Cengage Learning
Organic Chemistry
Chemistry
ISBN:9781305580350
Author:William H. Brown, Brent L. Iverson, Eric Anslyn, Christopher S. Foote
Publisher:Cengage Learning
Introductory Chemistry: An Active Learning Approa...
Chemistry
ISBN:9781305079250
Author:Mark S. Cracolice, Ed Peters
Publisher:Cengage Learning
Chemistry: Principles and Practice
Chemistry
ISBN:9780534420123
Author:Daniel L. Reger, Scott R. Goode, David W. Ball, Edward Mercer
Publisher:Cengage Learning
Organic Chemistry: A Guided Inquiry
Chemistry
ISBN:9780618974122
Author:Andrei Straumanis
Publisher:Cengage Learning
07 Physical Properties of Organic Compounds; Author: Mindset;https://www.youtube.com/watch?v=UjlSgwq4w6U;License: Standard YouTube License, CC-BY