
Concept explainers
Videos
(a.)
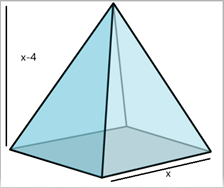
A labelled diagram of the sculpture in terms of
A labelled diagram of the sculpture in terms of

Given:
A sculpture is shaped as a pyramid with a square base.
The height of the pyramid is
The volume of the sculpture is
Concept used:
Assuming an unknown dimension as
Calculation:
Let
It is given that the height of the pyramid is
Then, the height of the pyramid shaped sculpture is
Now, a labelled diagram of the sculpture is given as follows,

Conclusion:
A labelled diagram of the sculpture in terms of
(b.)
A function that gives the volume
It has been determined that the function that gives the volume
Given:
A sculpture is shaped as a pyramid with a square base.
The height of the pyramid is
The volume of the sculpture is
Concept used:
The volume
Calculation:
As assumed previously,
Then, the area of the square base (in square inches) is given as
Now, according to the discussed formula, the volume
Rewriting,
This is the required function that gives the volume
Conclusion:
It has been determined that the function that gives the volume
(c.)
The graph of the function obtained in part (b) and the estimate of the value of
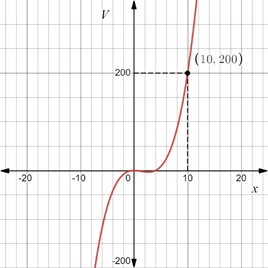
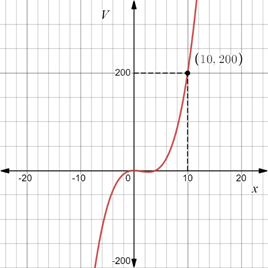
The graph of the function obtained in part (b) is given as:
It has been determined that the estimate of the value of
Given:
A sculpture is shaped as a pyramid with a square base.
The height of the pyramid is
The volume of the sculpture is
Concept used:
If either the abscissa or the ordinate is known, the corresponding ordinate or the abscissa can be obtained from the graph of the function.
Calculation:
The function obtained in part (b) is,
The graph of this function is given as,

It is given that the volume of the sculpture is
So,
It can be seen from the graph that
This is the required estimate.
Conclusion:
The graph of the function obtained in part (b) is given as:
It has been determined that the estimate of the value of
(d.)
The value of
The value of
It has been determined that the base of the sculpture is
Given:
A sculpture is shaped as a pyramid with a square base.
The height of the pyramid is
The volume of the sculpture is
Concept used:
An equation can be solved by factorizing.
Calculation:
The function obtained in part (b) is,
It is given that the volume of the sculpture is
So,
Put
Simplifying,
On further simplification,
Finally,
Factorizing,
Note that the discriminant of
This implies that the roots of
So, the only real root of the obtained equation is
Now, the estimated value from part (c.) was also
As assumed in part (a), the length of a side of the square base is
So, the base of the sculpture is
Conclusion:
The value of
It has been determined that the base of the sculpture is
Chapter 2 Solutions
EBK ALGEBRA 2


- The Course Name Real Analysis please Solve questions by Real Analysisarrow_forwardpart 3 of the question is: A power outage occurs 6 min after the ride started. Passengers must wait for their cage to be manually cranked into the lowest position in order to exit the ride. Sine function model: where h is the height of the last passenger above the ground measured in feet and t is the time of operation of the ride in minutes. What is the height of the last passenger at the moment of the power outage? Verify your answer by evaluating the sine function model. Will the last passenger to board the ride need to wait in order to exit the ride? Explain.arrow_forward2. The duration of the ride is 15 min. (a) How many times does the last passenger who boarded the ride make a complete loop on the Ferris wheel? (b) What is the position of that passenger when the ride ends?arrow_forward
- 3. A scientist recorded the movement of a pendulum for 10 s. The scientist began recording when the pendulum was at its resting position. The pendulum then moved right (positive displacement) and left (negative displacement) several times. The pendulum took 4 s to swing to the right and the left and then return to its resting position. The pendulum's furthest distance to either side was 6 in. Graph the function that represents the pendulum's displacement as a function of time. Answer: f(t) (a) Write an equation to represent the displacement of the pendulum as a function of time. (b) Graph the function. 10 9 8 7 6 5 4 3 2 1 0 t 1 2 3 4 5 6 7 8 9 10 11 12 13 14 15 -1 -5. -6 -7 -8 -9 -10-arrow_forwardA power outage occurs 6 min after the ride started. Passengers must wait for their cage to be manually cranked into the lowest position in order to exit the ride. Sine function model: h = −82.5 cos (3πt) + 97.5 where h is the height of the last passenger above the ground measured in feet and t is the time of operation of the ride in minutes. (a) What is the height of the last passenger at the moment of the power outage? Verify your answer by evaluating the sine function model. (b) Will the last passenger to board the ride need to wait in order to exit the ride? Explain.arrow_forwardThe Colossus Ferris wheel debuted at the 1984 New Orleans World's Fair. The ride is 180 ft tall, and passengers board the ride at an initial height of 15 ft above the ground. The height above ground, h, of a passenger on the ride is a periodic function of time, t. The graph displays the height above ground of the last passenger to board over the course of the 15 min ride. Height of Passenger in Ferris Wheel 180 160 140- €120 Height, h (ft) 100 80 60 40 20 0 ך 1 2 3 4 5 6 7 8 9 10 11 12 13 14 15 Time of operation, t (min) Sine function model: h = −82.5 cos (3πt) + 97.5 where h is the height of the passenger above the ground measured in feet and t is the time of operation of the ride in minutes. What is the period of the sine function model? Interpret the period you found in the context of the operation of the Ferris wheel. Answer:arrow_forward
- 1. Graph the function f(x)=sin(x) −2¸ Answer: y -2π 一元 1 −1 -2 -3 -4+ 元 2πarrow_forward3. Graph the function f(x) = −(x-2)²+4 Answer: f(x) 6 5 4 3 2+ 1 -6-5 -4-3-2-1 × 1 2 3 4 5 6 -1 -2+ ရာ -3+ -4+ -5 -6arrow_forward2. Graph the function f(x) = cos(2x)+1 Answer: -2π 一元 y 3 2- 1 -1 -2+ ရာ -3- Π 2πarrow_forward
- 2. Graph the function f(x) = |x+1+2 Answer: -6-5-4-3-2-1 f(x) 6 5 4 3 2 1 1 2 3 4 5 6 -1 -2 -3 -4 -5 -6arrow_forward1. The table shows values of a function f(x). What is the average rate of change of f(x) over the interval from x = 5 to x = 9? Show your work. X 4 f(x) LO 5 6 7 8 9 10 -2 8 10 11 14 18arrow_forward• Find a real-world situation that can be represented by a sinusoidal function. You may find something online that represents a sinusoidal graph or you can create a sinusoidal graph yourself with a measuring tape and a rope. • Provide a graph complete with labels and units for the x- and y-axes. • Describe the amplitude, period, and vertical shift in terms of the real-world situation.arrow_forward
 Algebra and Trigonometry (6th Edition)AlgebraISBN:9780134463216Author:Robert F. BlitzerPublisher:PEARSON
 Contemporary Abstract AlgebraAlgebraISBN:9781305657960Author:Joseph GallianPublisher:Cengage Learning
 Linear Algebra: A Modern IntroductionAlgebraISBN:9781285463247Author:David PoolePublisher:Cengage Learning
 Algebra And Trigonometry (11th Edition)AlgebraISBN:9780135163078Author:Michael SullivanPublisher:PEARSON
 Introduction to Linear Algebra, Fifth EditionAlgebraISBN:9780980232776Author:Gilbert StrangPublisher:Wellesley-Cambridge Press
 College Algebra (Collegiate Math)AlgebraISBN:9780077836344Author:Julie Miller, Donna GerkenPublisher:McGraw-Hill Education