Concept explainers
(a)
To infer:
About the relative costs and benefits of large brains documented in the fossil records of certain lineages of humans and other animals.
Concept introduction:
Animals with larger brain size are considered as more intelligent and hence they are more successful than animals with smaller brain size. The larger brain size can also help an animal in obtaining mates and therefore can increase their survival.
The larger brain size involves a higher cost, but it is outweighed by the survival benefits that an animal gets.
(b)
To hypothesize:
In what way the natural selection might have favored the evolution of large brains despite their high maintenance costs.
Concept introduction:
Animals with larger brain size are considered as more intelligent and hence they are more successful than animals with smaller brain size. The larger brain size can also help an animal in obtaining mates and therefore can increase their survival.
The larger brain size involves a higher cost, but it is outweighed by the survival benefits that an animal gets.
(c)
To graph:
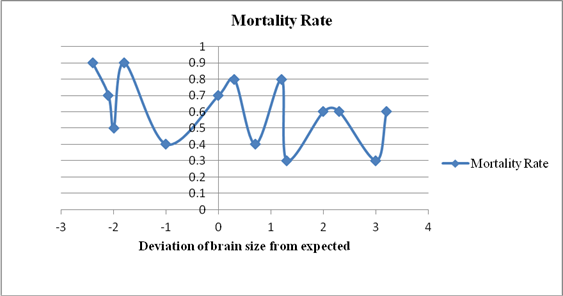
The data for 14 bird species and conclude about the relationship between brain size and mortality.
Concept introduction:
Animals with larger brain size are considered as more intelligent and hence they are more successful than animals with smaller brain size. The larger brain size can also help an animal in obtaining mates and therefore can increase their survival.
The larger brain size involves a higher cost, but it is outweighed by the survival benefits that an animal gets.
Graphical representation:
The graph between the mortality rate and deviation of brain size from expected is shown below:

Graph 1: Relationship between the mortality rate and deviation of brain size from the expected value. The x-axis represents the deviation of brain size from expected and the y-axis represents the mortality rate.
Want to see the full answer?
Check out a sample textbook solution
Chapter 27 Solutions
Campbell Biology in Focus, Books a la Carte Edition; Modified Mastering Biology with Pearson eText - ValuePack Access Card - for Campbell Biology in Focus (2nd Edition)
- Can you described the image? Can you explain the question as well their answer and how to get to an answer to an problem like this?arrow_forwardglg 112 mid unit assignment Identifying melting processesarrow_forwardGive only the mode of inheritance consistent with all three pedigrees and only two reasons that support this, nothing more, (it shouldn't take too long)arrow_forward
- Oarrow_forwardDescribe the principle of homeostasis.arrow_forwardExplain how the hormones of the glands listed below travel around the body to target organs and tissues : Pituitary gland Hypothalamus Thyroid Parathyroid Adrenal Pineal Pancreas(islets of langerhans) Gonads (testes and ovaries) Placentaarrow_forward
- What are the functions of the hormones produced in the glands listed below: Pituitary gland Hypothalamus Thyroid Parathyroid Adrenal Pineal Pancreas(islets of langerhans) Gonads (testes and ovaries) Placentaarrow_forwardDescribe the hormones produced in the glands listed below: Pituitary gland Hypothalamus Thyroid Parathyroid Adrenal Pineal Pancreas(islets of langerhans) Gonads (testes and ovaries) Placentaarrow_forwardPlease help me calculate drug dosage from the following information: Patient weight: 35 pounds, so 15.9 kilograms (got this by dividing 35 pounds by 2.2 kilograms) Drug dose: 0.05mg/kg Drug concentration: 2mg/mLarrow_forward
- A 25-year-old woman presents to the emergency department with a 2-day history of fever, chills, severe headache, and confusion. She recently returned from a trip to sub-Saharan Africa, where she did not take malaria prophylaxis. On examination, she is febrile (39.8°C/103.6°F) and hypotensive. Laboratory studies reveal hemoglobin of 8.0 g/dL, platelet count of 50,000/μL, and evidence of hemoglobinuria. A peripheral blood smear shows ring forms and banana-shaped gametocytes. Which of the following Plasmodium species is most likely responsible for her severe symptoms? A. Plasmodium vivax B. Plasmodium ovale C. Plasmodium malariae D. Plasmodium falciparumarrow_forwardStandard Concentration (caffeine) mg/L Absorbance Reading 10 0.322 20 0.697 40 1.535 60 2.520 80 3.100arrow_forwardPlease draw in the missing answer, thank youarrow_forward
 Concepts of BiologyBiologyISBN:9781938168116Author:Samantha Fowler, Rebecca Roush, James WisePublisher:OpenStax College
 Human Biology (MindTap Course List)BiologyISBN:9781305112100Author:Cecie Starr, Beverly McMillanPublisher:Cengage Learning
 Biology (MindTap Course List)BiologyISBN:9781337392938Author:Eldra Solomon, Charles Martin, Diana W. Martin, Linda R. BergPublisher:Cengage Learning
 Biology Today and Tomorrow without Physiology (Mi...BiologyISBN:9781305117396Author:Cecie Starr, Christine Evers, Lisa StarrPublisher:Cengage Learning
 Biology: The Dynamic Science (MindTap Course List)BiologyISBN:9781305389892Author:Peter J. Russell, Paul E. Hertz, Beverly McMillanPublisher:Cengage Learning
 Comprehensive Medical Assisting: Administrative a...NursingISBN:9781305964792Author:Wilburta Q. Lindh, Carol D. Tamparo, Barbara M. Dahl, Julie Morris, Cindy CorreaPublisher:Cengage Learning


