
(a)
Interpretation:
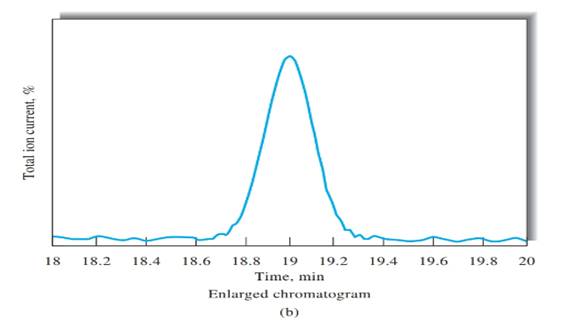
Retention time for cinnamaldehyde should be determined using Figure b.
Concept introduction:
The retention time of a substance can be determined using the chromatogram. The distance between the starting position (0) and the peak of the interested substance. From the x-axis of the chromatogram, retention time of the interested substance can be determined.
Answer to Problem 27.30QAP
Retention time = 19 min
Explanation of Solution
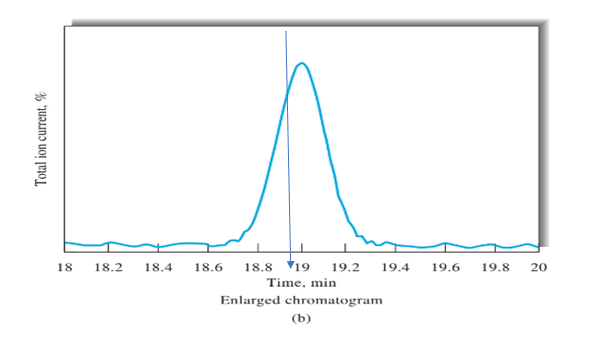
Figure b peak is obtained on the time of 19 mins, as shown using blue arrow. Therefore, retention time for cinnamaldehyde is 19 mins.
(b)
Interpretation:
Number of theoretical plates should be calculated using Figure b.
Concept introduction:
Answer to Problem 27.30QAP
N= 36,100
Explanation of Solution
Peak width, (W) should be determined first, in order to calculate the number of theoretical plates. Peak width can be determined using Figure b, indicated in black arrow.
(c)
Interpretation:
Plate height should be calculated using the information in part a and b.
Concept introduction:
Plate height can be calculated using the following equation.
Answer to Problem 27.30QAP
Plate height = 0.83 mm
Explanation of Solution
Given information:
L= 30 cm
(d)
Interpretation:
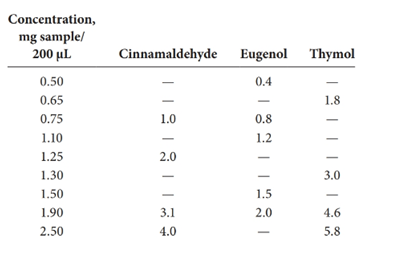
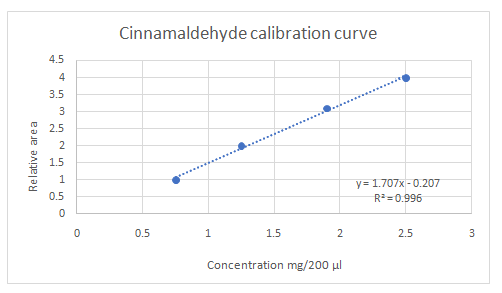
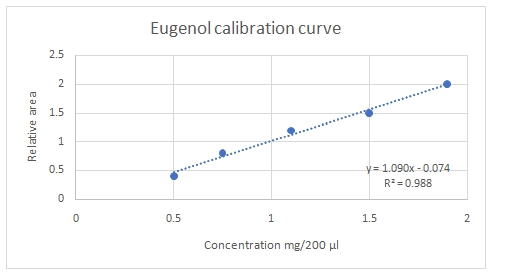
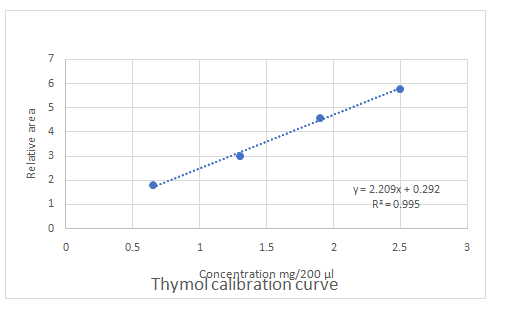
Calibration curves should be plotted for cinnamaldehyde, eugenol, and thymol. The R2 values for each compound also should be determined.
Concept introduction:
Standard addition method is an analytical method used in quantitative analysis of unknown samples. Calibration curves can be plotted, concentration vs relative peak area. That plot can be used to determine the unknown sample concentration.
Answer to Problem 27.30QAP
Explanation of Solution
Given information:
(e)
Interpretation:
Sensitivity levels of the calibration curves should be determined, as highest and lowest.
Concept introduction:
Linear regression R2 can be used to determine the linearity between two variables, with regard to this question the sensitivity of the calibration curve can be determined by the R2 value.
Answer to Problem 27.30QAP
Highest calibration curve sensitivity= Cinnamaldehyde
Lowest calibration curve sensitivity= Eugenol
Explanation of Solution
Higher the linear regression, higher the sensitivity of calibration curve. Linear regression R2 can be used to determine the linearity between two variables. Statistically, higher linear regression represents higher linearity/fitting of two variables to a linear equation.
Therefore, in this case cinnamaldehyde has the highest sensitivity, while eugenol has the lowest sensitivity.
(f)
Interpretation:
Concentrations of each component in the sample should be calculated. Then the standard deviation also should be calculated.
Concept introduction:
The equation obtained from the calibration curve in part d can be used in the calculation of concentrations of unknown samples.
Answer to Problem 27.30QAP
Standard deviations of:
Cinnamaldehyde=1.130
Eugenol=0.564
Thymol= 1.523
Explanation of Solution
Given information:
Information provided in the question that is used to solve this particular category
Relative peak areas:
Cinnamaldehyde=2.6
Eugenol=0.9
Thymol=3.8
Detailed explanation/work out of the complete problem.
Standard deviations were calculated using Excel sheets.
(g)
Interpretation:
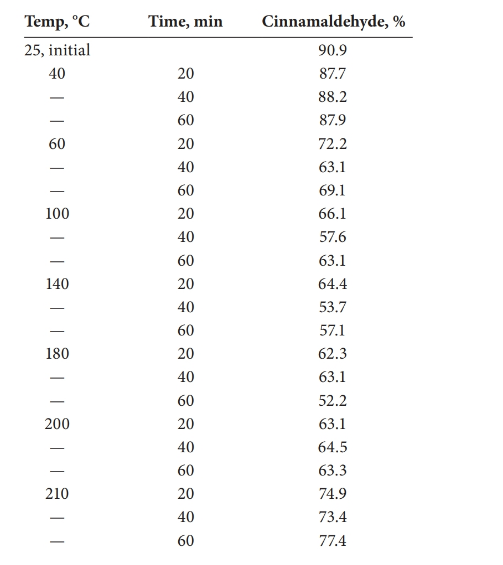
The statistical effect should be calculated for the decomposition of cinnamaldehyde with the temperature.
Concept introduction:
Analysis of variance (ANOVA) test can be done in order to determine whether there is a statistical effect on temperature for the decomposition of cinnamaldehyde.
Answer to Problem 27.30QAP
There is a statistical effect on the decomposition of cinnamaldehyde.
Explanation of Solution
Given information:
Detailed explanation/work out of the complete problem.
The test was carried out using Excel.
| Anova: Single Factor | ||||||
| SUMMARY | ||||||
| Groups | Count | Sum | Average | Variance | ||
| Column 1 | 7 | 930 | 132.8571 | 4623.81 | ||
| Column 2 | 7 | 490.7 | 70.1 | 82.59 | ||
| ANOVA | ||||||
| Source of Variation | SS | df | MS | F | P-value | F crit |
| Between Groups | 13784.61 | 1 | 13784.61 | 5.857814 | 0.0323 | 4.747225 |
| Within Groups | 28238.4 | 12 | 2353.2 | |||
| Total | 42023 | 13 | ||||
| Anova: Two-Factor Without Replication | ||||||
| SUMMARY | Count | Sum | Average | Variance | ||
| 20 | 7 | 490.7 | 70.1 | 82.59 | ||
| 40 | 7 | 463.6 | 66.22857 | 131.359 | ||
| 60 | 7 | 470.1 | 67.15714 | 149.1929 | ||
| 40 | 3 | 263.8 | 87.93333 | 0.063333 | ||
| 60 | 3 | 204.4 | 68.13333 | 21.40333 | ||
| 100 | 3 | 186.8 | 62.26667 | 18.58333 | ||
| 140 | 3 | 175.2 | 58.4 | 29.89 | ||
| 180 | 3 | 177.6 | 59.2 | 36.91 | ||
| 200 | 3 | 190.9 | 63.63333 | 0.573333 | ||
| 210 | 3 | 225.7 | 75.23333 | 4.083333 | ||
| ANOVA | ||||||
| Source of Variation | SS | df | MS | F | P-value | F crit |
| Rows | 57.19143 | 2 | 28.59571 | 2.06938 | 0.168992 | 3.885294 |
| Columns | 2013.03 | 6 | 335.5049 | 24.27942 | 4.75E-06 | 2.99612 |
| Error | 165.8219 | 12 | 13.81849 | |||
| Total | 2236.043 | 20 | ||||
(h)
Interpretation:
The test should be carried out to the hypothesis that, there is no effect of temperature or time on the decomposition of the sample.
Concept introduction:
Statistical test ANOVA should be carried out in order to check the hypothesis.
Answer to Problem 27.30QAP
Check the explanation part.
Explanation of Solution
| Anova: Two-Factor Without Replication | ||||||
| SUMMARY | Count | Sum | Average | Variance | ||
| 20 | 6 | 403 | 67.16667 | 26.83067 | ||
| 40 | 6 | 375.4 | 62.56667 | 44.99067 | ||
| 60 | 6 | 382.2 | 63.7 | 78.636 | ||
| 60 | 3 | 204.4 | 68.13333 | 21.40333 | ||
| 100 | 3 | 186.8 | 62.26667 | 18.58333 | ||
| 140 | 3 | 175.2 | 58.4 | 29.89 | ||
| 180 | 3 | 177.6 | 59.2 | 36.91 | ||
| 200 | 3 | 190.9 | 63.63333 | 0.573333 | ||
| 210 | 3 | 225.7 | 75.23333 | 4.083333 | ||
| ANOVA | ||||||
| Source of Variation | SS | df | MS | F | P-value | F crit |
| Rows | 68.92444 | 2 | 34.46222 | 2.238356 | 0.157272 | 4.102821 |
| Columns | 598.3244 | 5 | 119.6649 | 7.772354 | 0.003183 | 3.325835 |
| Error | 153.9622 | 10 | 15.39622 | |||
| Total | 821.2111 | 17 | ||||
Want to see more full solutions like this?
Chapter 27 Solutions
Principles of Instrumental Analysis, 6th Edition

- Using the bond energy values, calculate the energy that must be supplied or is released upon the polymerization of 755 monomers. If energy must be supplied, provide a positive number; if energy is released, provide a negative number. Hint: Avogadro’s number is 6.02 × 1023.arrow_forward-AG|F=2E|V 3. Before proceeding with this problem you may want to glance at p. 466 of your textbook where various oxo-phosphorus derivatives and their oxidation states are summarized. Shown below are Latimer diagrams for phosphorus at pH values at 0 and 14: Acidic solution -0.93 +0.38 -0.51 -0.06 H3PO4 →H4P206 H3PO3 H3PO2 → P→ PH3 -0.28 -0.50 → -0.50 Basic solution 3-1.12 -1.57 -2.05 -0.89 PO HPO →→H2PO2 P PH3 -1.73 a) Under acidic conditions, H3PO4 can be reduced into H3PO3 directly (-0.28V), or via the formation and reduction of H4P2O6 (-0.93/+0.38V). Calculate the values of AG's for both processes; comment. (3 points) 0.5 PH, 0.0 -0.5- 2 3 9 3 -1.5 -2.0 Pa H,PO H,PO H,PO -3 -1 0 2 4 Oxidation state, N 2 b) Frost diagram for phosphorus under acidic conditions is shown. Identify possible disproportionation and comproportionation processes; write out chemical equations describing them. (2 points) c) Elemental phosphorus tends to disproportionate under basic conditions. Use data in…arrow_forwardThese two reactions appear to start with the same starting materials but result in different products. How do the chemicals know which product to form? Are both products formed, or is there some information missing that will direct them a particular way?arrow_forward
- What would be the best choices for the missing reagents 1 and 3 in this synthesis? 1. PPh3 3 1 2 2. n-BuLi • Draw the missing reagents in the drawing area below. You can draw them in any arrangement you like. • Do not draw the missing reagent 2. If you draw 1 correctly, we'll know what it is. • Note: if one of your reagents needs to contain a halogen, use bromine. Explanation Check Click and drag to start drawing a structure. 2025 McGraw Hill LLC. All Rights Reserved. Terms of Use | Priva ×arrow_forwardPredict the products of this organic reaction: Explanation Check IN NaBH3CN H+ ? Click and drag to start drawing a structure. D 5 C +arrow_forwardPredict the products of this organic reaction: H3O+ + ? • Draw all the reasonable products in the drawing area below. If there are no products, because no reaction will occur, check the box under the drawing area. • Include both major and minor products, if some of the products will be more common than others. • Be sure to use wedge and dash bonds if you need to distinguish between enantiomers. No reaction. Click and drag to start drawing a structure. dmarrow_forward
- Iarrow_forwardDraw the anti-Markovnikov product of the hydration of this alkene. this problem. Note for advanced students: draw only one product, and don't worry about showing any stereochemistry. Drawing dash and wedge bonds has been disabled for esc esc ☐ Explanation Check F1 1 2 F2 # 3 F3 + $ 14 × 1. BH THE BH3 2. H O NaOH '2 2' Click and drag to start drawing a structure. F4 Q W E R A S D % 905 LL F5 F6 F7 © 2025 McGraw Hill LLC. All Rights Reserved. Terms of Use | Privacy Center | Accessibility < & 6 7 27 8 T Y U G H I F8 F9 F10 F11 F12 9 0 J K L P + // command option Z X C V B N M H H rol option commandarrow_forwardAG/F-2° V 3. Before proceeding with this problem you may want to glance at p. 466 of your textbook where various oxo-phosphorus derivatives and their oxidation states are summarized. Shown below are Latimer diagrams for phosphorus at pH values at 0 and 14: -0.93 +0.38 -0.50 -0.51 -0.06 H3PO4 →H4P206 →H3PO3 →→H3PO₂ → P → PH3 Acidic solution Basic solution -0.28 -0.50 3--1.12 -1.57 -2.05 -0.89 PO HPO H₂PO₂ →P → PH3 -1.73 a) Under acidic conditions, H3PO4 can be reduced into H3PO3 directly (-0.28V), or via the formation and reduction of H4P206 (-0.93/+0.38V). Calculate the values of AG's for both processes; comment. (3 points) 0.5 PH P 0.0 -0.5 -1.0- -1.5- -2.0 H.PO, -2.3+ -3 -2 -1 1 2 3 2 H,PO, b) Frost diagram for phosphorus under acidic conditions is shown. Identify possible disproportionation and comproportionation processes; write out chemical equations describing them. (2 points) H,PO 4 S Oxidation stale, Narrow_forward
- 4. For the following complexes, draw the structures and give a d-electron count of the metal: a) Tris(acetylacetonato)iron(III) b) Hexabromoplatinate(2-) c) Potassium diamminetetrabromocobaltate(III) (6 points)arrow_forward2. Calculate the overall formation constant for [Fe(CN)6]³, given that the overall formation constant for [Fe(CN)6] 4 is ~1032, and that: Fe3+ (aq) + e = Fe²+ (aq) E° = +0.77 V [Fe(CN)6]³ (aq) + e¯ = [Fe(CN)6] (aq) E° = +0.36 V (4 points)arrow_forward5. Consider the compounds shown below as ligands in coordination chemistry and identify their denticity; comment on their ability to form chelate complexes. (6 points) N N A B N N N IN N Carrow_forward
 Principles of Instrumental AnalysisChemistryISBN:9781305577213Author:Douglas A. Skoog, F. James Holler, Stanley R. CrouchPublisher:Cengage Learning
 Organic ChemistryChemistryISBN:9781305580350Author:William H. Brown, Brent L. Iverson, Eric Anslyn, Christopher S. FootePublisher:Cengage Learning
 Macroscale and Microscale Organic ExperimentsChemistryISBN:9781305577190Author:Kenneth L. Williamson, Katherine M. MastersPublisher:Brooks Cole