
EP INTRODUCTION TO PROBABILITY+STAT.
14th Edition
ISBN: 2810019974203
Author: Mendenhall
Publisher: CENGAGE L
expand_more
expand_more
format_list_bulleted
Concept explainers
Videos
Textbook Question
Chapter 2.7, Problem 2.53E
What’s Normal? again Refer to Exercise1.67 and data set EX0167. In addition to the normalbody temperature in degrees Fahrenheit for the 130individuals, the data record the gender of the individuals. Box plots for the two groups, male and female, are shown below:13
Box plots for Exercise 2.53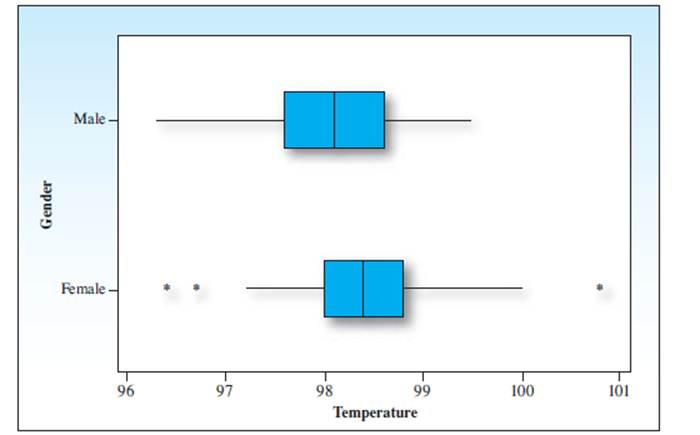
How would you describe the similarities and differences between male and female temperatures in thisdata set?
Expert Solution & Answer

Trending nowThis is a popular solution!

Students have asked these similar questions
The following data represent total ventilation measured in liters of air per minute per square meter of body area for two independent (and randomly chosen) samples.
Analyze these data using the appropriate non-parametric hypothesis test
each column represents before & after measurements on the same individual. Analyze with the appropriate non-parametric hypothesis test for a paired design.
Should you be confident in applying your regression equation to estimate the heart rate of a python at 35°C? Why or why not?
Chapter 2 Solutions
EP INTRODUCTION TO PROBABILITY+STAT.
Ch. 2.2 - You are given n=5 measurements: 0, 5, 1, 1,3. Draw...Ch. 2.2 - Prob. 2.2ECh. 2.2 - Prob. 2.3ECh. 2.2 - Auto Insurance The cost of automobile insurance...Ch. 2.2 - Prob. 2.5ECh. 2.2 - Prob. 2.6ECh. 2.2 - Prob. 2.7ECh. 2.2 - Prob. 2.8ECh. 2.2 - Prob. 2.9ECh. 2.2 - Prob. 2.10E
Ch. 2.2 - Prob. 2.11ECh. 2.2 - Prob. 2.12ECh. 2.3 - You are given n=5 measurements: 2, 1, 1,3,5. a....Ch. 2.3 - Prob. 2.14ECh. 2.3 - Prob. 2.15ECh. 2.3 - Prob. 2.16ECh. 2.3 - Prob. 2.17ECh. 2.3 - Utility Bills in Southern CaliforniaThe monthly...Ch. 2.5 - Prob. 2.19ECh. 2.5 - Prob. 2.20ECh. 2.5 - A distribution of measurements is relatively...Ch. 2.5 - Prob. 2.22ECh. 2.5 - Prob. 2.23ECh. 2.5 - Packaging Hamburger Meat The data listed here are...Ch. 2.5 - Breathing Rates Is your breathing rate normal?...Ch. 2.5 - Prob. 2.26ECh. 2.5 - Social Security Numbers A group of70 students were...Ch. 2.5 - Prob. 2.28ECh. 2.5 - Prob. 2.29ECh. 2.5 - Prob. 2.30ECh. 2.5 - Timber Tracts To estimate the amount of lumber in...Ch. 2.5 - Prob. 2.32ECh. 2.5 - Prob. 2.33ECh. 2.5 - Prob. 2.34ECh. 2.5 - Prob. 2.35ECh. 2.5 - Prob. 2.36ECh. 2.5 - Prob. 2.37ECh. 2.5 - Prob. 2.38ECh. 2.5 - Prob. 2.39ECh. 2.7 - Prob. 2.40ECh. 2.7 - Find the five-number summary and the IQR forthese...Ch. 2.7 - Given the following data set: 2.3, 1.0, 2.1, 6.5,...Ch. 2.7 - Given the following data set: .23, .30, .35, .41,...Ch. 2.7 - Construct a box plot for these data and...Ch. 2.7 - Construct a box plot for these data and...Ch. 2.7 - If you scored at the 69th percentile on a...Ch. 2.7 - Mercury Concentration in DolphinsEnvironmental...Ch. 2.7 - Hamburger Meat The weights (in pounds) of the 27...Ch. 2.7 - Comparing NFL Quarterbacks How does Aaron Rodgers,...Ch. 2.7 - Presidential Vetoes The set of presidential vetoes...Ch. 2.7 - Survival Times Altman and Bland report the...Ch. 2.7 - Utility Bills in Southern California, again The...Ch. 2.7 - What’s Normal? again Refer to Exercise1.67 and...Ch. 2 - Raisins The number of raisins in each of...Ch. 2 - Prob. 2.55SECh. 2 - Prob. 2.56SECh. 2 - A Recurring IIIness Refer to Exercise 1.26 and...Ch. 2 - Prob. 2.58SECh. 2 - Prob. 2.59SECh. 2 - Tuna Fish, again Refer to Exercise 2.8. Theprices...Ch. 2 - Prob. 2.61SECh. 2 - Chloroform According to the EPA, Chloroform, which...Ch. 2 - Prob. 2.63SECh. 2 - Sleep and the College Student How muchsleep do you...Ch. 2 - Prob. 2.65SECh. 2 - Prob. 2.66SECh. 2 - Polluted Seawater Petroleum pollution in seasand...Ch. 2 - Prob. 2.68SECh. 2 - Prob. 2.69SECh. 2 - Prob. 2.70SECh. 2 - Prob. 2.71SECh. 2 - Prob. 2.72SECh. 2 - Prob. 2.73SECh. 2 - Prob. 2.74SECh. 2 - TV Commercials The mean duration oftelevision...Ch. 2 - Prob. 2.76SECh. 2 - Prob. 2.77SECh. 2 - Prob. 2.78SECh. 2 - Prob. 2.79SECh. 2 - Prob. 2.80SECh. 2 - Prob. 2.81SECh. 2 - Prob. 2.82SECh. 2 - Prob. 2.83SECh. 2 - Prob. 2.84SECh. 2 - Prob. 2.85SE
Knowledge Booster


Learn more about
Need a deep-dive on the concept behind this application? Look no further. Learn more about this topic, statistics and related others by exploring similar questions and additional content below.Similar questions
- Given your fitted regression line, what would be the residual for snake #5 (10 C)?arrow_forwardCalculate the 95% confidence interval around your estimate of r using Fisher’s z-transformation. In your final answer, make sure to back-transform to the original units.arrow_forwardCalculate Pearson’s correlation coefficient (r) between temperature and heart rate.arrow_forward
- A researcher wishes to estimate, with 90% confidence, the population proportion of adults who support labeling legislation for genetically modified organisms (GMOs). Her estimate must be accurate within 4% of the true proportion. (a) No preliminary estimate is available. Find the minimum sample size needed. (b) Find the minimum sample size needed, using a prior study that found that 65% of the respondents said they support labeling legislation for GMOs. (c) Compare the results from parts (a) and (b). ... (a) What is the minimum sample size needed assuming that no prior information is available? n = (Round up to the nearest whole number as needed.)arrow_forwardThe table available below shows the costs per mile (in cents) for a sample of automobiles. At a = 0.05, can you conclude that at least one mean cost per mile is different from the others? Click on the icon to view the data table. Let Hss, HMS, HLS, Hsuv and Hмy represent the mean costs per mile for small sedans, medium sedans, large sedans, SUV 4WDs, and minivans respectively. What are the hypotheses for this test? OA. Ho: Not all the means are equal. Ha Hss HMS HLS HSUV HMV B. Ho Hss HMS HLS HSUV = μMV Ha: Hss *HMS *HLS*HSUV * HMV C. Ho Hss HMS HLS HSUV =μMV = = H: Not all the means are equal. D. Ho Hss HMS HLS HSUV HMV Ha Hss HMS HLS =HSUV = HMVarrow_forwardQuestion: A company launches two different marketing campaigns to promote the same product in two different regions. After one month, the company collects the sales data (in units sold) from both regions to compare the effectiveness of the campaigns. The company wants to determine whether there is a significant difference in the mean sales between the two regions. Perform a two sample T-test You can provide your answer by inserting a text box and the answer must include: Null hypothesis, Alternative hypothesis, Show answer (output table/summary table), and Conclusion based on the P value. (2 points = 0.5 x 4 Answers) Each of these is worth 0.5 points. However, showing the calculation is must. If calculation is missing, the whole answer won't get any credit.arrow_forward
arrow_back_ios
SEE MORE QUESTIONS
arrow_forward_ios
Recommended textbooks for you
 Holt Mcdougal Larson Pre-algebra: Student Edition...AlgebraISBN:9780547587776Author:HOLT MCDOUGALPublisher:HOLT MCDOUGAL
 Glencoe Algebra 1, Student Edition, 9780079039897...AlgebraISBN:9780079039897Author:CarterPublisher:McGraw Hill
 Big Ideas Math A Bridge To Success Algebra 1: Stu...AlgebraISBN:9781680331141Author:HOUGHTON MIFFLIN HARCOURTPublisher:Houghton Mifflin Harcourt
 Functions and Change: A Modeling Approach to Coll...AlgebraISBN:9781337111348Author:Bruce Crauder, Benny Evans, Alan NoellPublisher:Cengage Learning
 College Algebra (MindTap Course List)AlgebraISBN:9781305652231Author:R. David Gustafson, Jeff HughesPublisher:Cengage Learning
 Algebra: Structure And Method, Book 1AlgebraISBN:9780395977224Author:Richard G. Brown, Mary P. Dolciani, Robert H. Sorgenfrey, William L. ColePublisher:McDougal Littell
Holt Mcdougal Larson Pre-algebra: Student Edition...
Algebra
ISBN:9780547587776
Author:HOLT MCDOUGAL
Publisher:HOLT MCDOUGAL
Glencoe Algebra 1, Student Edition, 9780079039897...
Algebra
ISBN:9780079039897
Author:Carter
Publisher:McGraw Hill
Big Ideas Math A Bridge To Success Algebra 1: Stu...
Algebra
ISBN:9781680331141
Author:HOUGHTON MIFFLIN HARCOURT
Publisher:Houghton Mifflin Harcourt
Functions and Change: A Modeling Approach to Coll...
Algebra
ISBN:9781337111348
Author:Bruce Crauder, Benny Evans, Alan Noell
Publisher:Cengage Learning
College Algebra (MindTap Course List)
Algebra
ISBN:9781305652231
Author:R. David Gustafson, Jeff Hughes
Publisher:Cengage Learning
Algebra: Structure And Method, Book 1
Algebra
ISBN:9780395977224
Author:Richard G. Brown, Mary P. Dolciani, Robert H. Sorgenfrey, William L. Cole
Publisher:McDougal Littell
The Shape of Data: Distributions: Crash Course Statistics #7; Author: CrashCourse;https://www.youtube.com/watch?v=bPFNxD3Yg6U;License: Standard YouTube License, CC-BY
Shape, Center, and Spread - Module 20.2 (Part 1); Author: Mrmathblog;https://www.youtube.com/watch?v=COaid7O_Gag;License: Standard YouTube License, CC-BY
Shape, Center and Spread; Author: Emily Murdock;https://www.youtube.com/watch?v=_YyW0DSCzpM;License: Standard Youtube License