Concept explainers
Videos
(a)
Interpretation:
The name of
Concept introduction:
The systematic naming of organic compound is given by IUPAC. The naming of organic compound is done such that the structure of organic compound is correctly interpreted from the name.
(b)
Interpretation:
The name of
Concept introduction:
The systematic naming of organic compound is given by IUPAC. The naming of organic compound is done such that the structure of organic compound is correctly interpreted from the name.
(c)
Interpretation:
The name of following compound should be predicted.
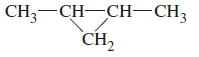
Concept introduction:
The systematic naming of organic compound is given by IUPAC. The naming of organic compound is done such that the structure of organic compound is correctly interpreted from the name.
(d)
Interpretation:
The name of
Concept introduction:
The systematic naming of organic compound is given by IUPAC. The naming of organic compound is done such that the structure of organic compound is correctly interpreted from the name.
(e)
Interpretation:
The name of
Concept introduction:
The systematic naming of organic compound is given by IUPAC. The naming of organic compound is done such that the structure of organic compound is correctly interpreted from the name.
(f)
Interpretation:
The name of
Concept introduction:
The systematic naming of organic compound is given by IUPAC. The naming of organic compound is done such that the structure of organic compound is correctly interpreted from the name.
Want to see the full answer?
Check out a sample textbook solution
Chapter 26 Solutions
EBK GENERAL CHEMISTRY


- A mixture of C7H12O2, C9H9OCl, biphenyl and acetone was put together in a gas chromatography tube. Please decide from the GC resutls which correspond to the peak for C7,C9 and biphenyl and explain the reasoning based on GC results. Eliminate unnecessary peaks from Gas Chromatography results.arrow_forwardIs the molecule chiral, meso, or achiral? CI .CH3 H₂C CIarrow_forwardPLEASE HELP ! URGENT!arrow_forward
- Identify priority of the substituents: CH3arrow_forwardHow many chiral carbons are in the molecule? OH F CI Brarrow_forwardA mixture of three compounds Phen-A, Acet-B and Rin-C was analyzed using TLC with 1:9 ethanol: hexane as the mobile phase. The TLC plate showed three spots of R, 0.1 and 0.2 and 0.3. Which of the three compounds (Phen-A; Acet-B or Rin-C) would have the highest (Blank 1), middle (Blank 2) and lowest (Blank 3) spot respectively? 0 CH: 0 CH, 0 H.C OH H.CN OH Acet-B Rin-C phen-A A A <arrow_forward

 Chemistry for Today: General, Organic, and Bioche...ChemistryISBN:9781305960060Author:Spencer L. Seager, Michael R. Slabaugh, Maren S. HansenPublisher:Cengage Learning
 Organic Chemistry: A Guided InquiryChemistryISBN:9780618974122Author:Andrei StraumanisPublisher:Cengage Learning