
Videos
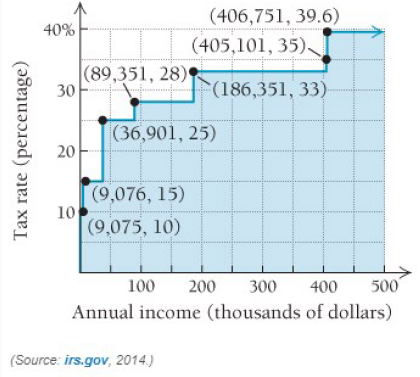
Businesses and individuals are frequently concerned about their marginal tax rate, or the rate at which the next dollar earned is taxed In progressive taxation, the 80,001 st dollar earned is taxed at a higher rate than the 25.001 st dollar earned and at a lower rate than the 140,001 st dollar earned Use the following graph, showing the marginal tax rate for 2014 for single filers, to answer Exercises 23-26.
| Single Filers Income Bracket | Rate |
|---|---|
| 0–9075 | 10% |
| 9076–36900 | 15% |
| 36901–89350 | 25% |
| 89351–186350 | 28% |
| 186351–405100 | 33% |
| 405101–406750 | 35% |
| 406751+ | 39.6% |
Alan earns $85,000 per year and is considering a second job that would earn him another $10,000 annually At what rate will his tax liability (the amount he must pay in taxes) change if he takes the extra job? Express your answer in tax dollars paid per dollar earned.
Want to see the full answer?
Check out a sample textbook solution
Chapter 2 Solutions
Calculus and Its Applications (11th Edition)
Additional Math Textbook Solutions
College Algebra with Modeling & Visualization (5th Edition)
Intro Stats, Books a la Carte Edition (5th Edition)
Calculus: Early Transcendentals (2nd Edition)
Elementary Statistics (13th Edition)
Basic Business Statistics, Student Value Edition
Algebra and Trigonometry (6th Edition)


- = Q6 What will be the allowable bearing capacity of sand having p = 37° and ydry 19 kN/m³ for (i) 1.5 m strip foundation (ii) 1.5 m x 1.5 m square footing and (iii)1.5m x 2m rectangular footing. The footings are placed at a depth of 1.5 m below ground level. Assume F, = 2.5. Use Terzaghi's equations. 0 Ne Na Ny 35 57.8 41.4 42.4 40 95.7 81.3 100.4arrow_forwardQ1 The SPT records versus depth are given in table below. Find qan for the raft 12% foundation with BxB-10x10m and depth of raft D-2m, the allowable settlement is 50mm. Elevation, m 0.5 2 2 6.5 9.5 13 18 25 No.of blows, N 11 15 29 32 30 44 0 estigate shear 12%arrow_forwardQ2 A/ State the main field tests which may be carried out to investigate shear strength of a soil layer? B/ What are the main factors that affecting the spacing and number of boreholes for a given project? C/ Illustrate the causes of disturbance of Shelby tubes samples.arrow_forward
- Trolley of the overhead crane moves along the bridge rail. The trolley position is measured from the center of the bridge rail (x = 0) is given by x(t) = 0.5t^3-6t^2+19.5t-14 : 0 <= t <= 3 min. The trolley moves from point A to B in the forward direction, B to C in the reverse direction and C to D again in the forward direction. CONTROL PANEL END TRUCK- RUNWAY BEAM- BRIDGE RAIL HOIST -TROLLEY TROLLEY BUMPER TROLLEY DRIVE LPENDANT TRACK -TROLLEY CONDUCTOR TRACK WIRE ROPE -HOOK BLOCK -BRIDGE DRIVE -END TRUCK BUMPER -RUNWAY RAIL TROLLEY END STOP -CONDUCTOR BAR PENDANT FESTOONING TROLLEY FESTOONING PENDANT CABLE PENDANT x(t)=0.5t^3-6t^2+19.5t-14 v(t)=1.5t^2-12t+19.5 a(t)=(dv(t))/dt=3t-12 Fig. T2.2: The overhead crane Total masses of the trolley, hook block, and the load attached to the hook block are 110 kg, 20 kg, and 150 kg. Damping coefficient, D, is 40 kg/s. What is the total amount of energy required from the trolley motor to move the system [Hint: Use Newton's 2nd law to obtain the…arrow_forwardCONTROL PANEL- BRIDGE RAIL HOIST -TROLLEY TROLLEY BUMPER -BRIDGE DRIVE END TRUCK- RUNWAY BEAM- END TRUCK BUMPER -RUNWAY RAIL TROLLEY DRIVE TROLLEY END STOP -CONDUCTOR BAR LPENDANT TRACK TROLLEY CONDUCTOR TRACK -WIRE ROPE PENDANT FESTOONING TROLLEY FESTOONING -PENDANT CABLE -HOOK BLOCK PENDANTarrow_forwardchool Which of the following functions describes the graph of g(x)--2√9-x²+37 9 8 7 6 4 2 -10-9-8-7-6-5-4-3-2-1 1 -1 -2 -4 -6 10 9 8 B 5 4 3 3 6 -10-9-8-7-6-5-4-3-2-1 2 3 4 6 1 -2 4 -5 -6 -8 -9 -10 10 -10-9-8-7-6-5-4-3-2-1 9 8 Lessons Assessments 6 5 4 + 2 1 1 2 3 4 5 6 8 -1 2 4 -5 -B 8 10 10 9 8 7 6 5 4 3 2 1 -10-9-8-7-6-5-4-3-2-1 1 2 3 4 5 6 B 9 10 -1 -2 -3 -5arrow_forward
- Please sketch questions 1, 2 and 6arrow_forwardsolve questions 3, 4,5, 7, 8, and 9arrow_forward4. Please solve this for me and show every single step. I am studying and got stuck on this practice question, and need help in solving it. Please be very specific and show every step. Thanks. I WANT A HUMAN TO SOLVE THIS PLEASE.arrow_forward
 Big Ideas Math A Bridge To Success Algebra 1: Stu...AlgebraISBN:9781680331141Author:HOUGHTON MIFFLIN HARCOURTPublisher:Houghton Mifflin Harcourt
 College Algebra (MindTap Course List)AlgebraISBN:9781305652231Author:R. David Gustafson, Jeff HughesPublisher:Cengage Learning
 Holt Mcdougal Larson Pre-algebra: Student Edition...AlgebraISBN:9780547587776Author:HOLT MCDOUGALPublisher:HOLT MCDOUGAL
 College AlgebraAlgebraISBN:9781305115545Author:James Stewart, Lothar Redlin, Saleem WatsonPublisher:Cengage Learning
 Functions and Change: A Modeling Approach to Coll...AlgebraISBN:9781337111348Author:Bruce Crauder, Benny Evans, Alan NoellPublisher:Cengage Learning