
Videos
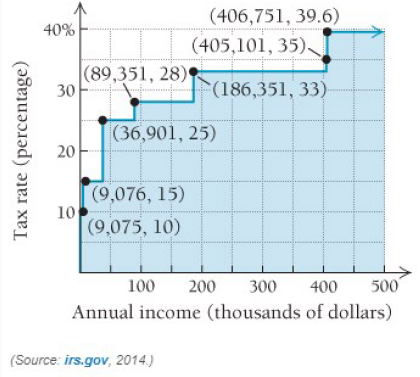
Businesses and individuals are frequently concerned about their marginal tax rate, or the rate at which the next dollar earned is taxed In progressive taxation, the 80,001 st dollar earned is taxed at a higher rate than the 25.001 st dollar earned and at a lower rate than the 140,001 st dollar earned Use the following graph, showing the marginal tax rate for 2014 for single filers, to answer Exercises 23-26.
| Single Filers Income Bracket | Rate |
|---|---|
| 0–9075 | 10% |
| 9076–36900 | 15% |
| 36901–89350 | 25% |
| 89351–186350 | 28% |
| 186351–405100 | 33% |
| 405101–406750 | 35% |
| 406751+ | 39.6% |
Alan earns $85,000 per year and is considering a second job that would earn him another $10,000 annually At what rate will his tax liability (the amount he must pay in taxes) change if he takes the extra job? Express your answer in tax dollars paid per dollar earned.
Want to see the full answer?
Check out a sample textbook solution
Chapter 2 Solutions
Calculus and Its Applications (11th Edition)
Additional Math Textbook Solutions
University Calculus: Early Transcendentals (3rd Edition)
Precalculus Enhanced with Graphing Utilities (7th Edition)
University Calculus: Early Transcendentals (4th Edition)
Calculus, Single Variable: Early Transcendentals (3rd Edition)


- Table 6 shows the year and the number ofpeople unemployed in a particular city for several years. Determine whether the trend appears linear. If so, and assuming the trend continues, in what year will the number of unemployed reach 5 people?arrow_forwardIf you travel 100 miles in two hours, then your average speed for the trip is Average speed=_________=________arrow_forwardHeart Disease In a certain country, the number of deaths due to heart disease decreased from 235 in one year to 221 in the next year. What percentage decrease in deaths due to heart disease does this represent?arrow_forward
- draw a line graph following this information. The line graph depicts the historical and projected sales volume of Pepsi Co Jamaica's Diet Pepsi for the next fiscal year, with the horizontal axis representing the four quarters of the year, and the vertical axis representing the sales volume in million cases. The historical sales data is represented by a line that shows a sales volume of 1 million cases for the past fiscal year. The projected sales volume is represented by another line that shows an expected increase in sales volume to 1.5 million cases for the next fiscal year. The sales targets for each quarter are represented by markers or points on the graph, with the first quarter expected to reach 0.4 million cases, the second quarter at 0.5 million cases, the third quarter at 0.3 million cases, and the fourth quarter at 0.3 million cases.arrow_forwardbike increases its speed by five meters per second every 10 seconds. Which graph shows this relationship? 501 45 50 45 40 35 30 25 35 A. B. 010 20 30 4050 Time (sec) 10 20 30 4050 Time (sec) 50 10 35 30 D. C. 10 20 30 40 50 Time (sec) 10 20 30 40 50 Time (sec) Snonon onon o n44332211 Speed (m/sec) Speed (m/sec) nttmm2211arrow_forwardAnswer the circled onesarrow_forward
- The table below shows a recent graduate's credit card balance each month after graduation. Month 1 2 3 4 5 6 7 8 Debt ($) 620.00 761.88 899.80 1039.93 1270.63 1589.04 1851.31 2154.92 a) Look at the graph on your calculator. Based on this graph, what type of equation should represent this situation? Explain your answer. b) Use your calculator to find the equation that you feel best fits this data. What is the equation? c) Based on this equation, what is the predicted amount of debt for month 9 after graduation?arrow_forwardThe line graphs in Figure show the percentages of marriages ending in divorce based on the wife’s age at marriage.Here are two mathematical models that approximate the data displayed by the line graphs:In each model, the variable n is the number of years after marriage and the variable d is the percentage of marriages ending in divorce.a. Use the appropriate formula to determine the percentage of marriagesending in divorce after 10 years when the wife is over 25 at the time ofmarriage.b. Use the appropriate line graph in Figure to determine the percentageof marriages ending in divorce after 10 years when the wife is over 25 at the time of marriage.c. Does the value given by the mathematical model underestimate or overestimate the actual percentage of marriages ending in divorce after10 years as shown by the graph? By how much?arrow_forwardGive an example of a nominal variable for people in recovery for substance abusearrow_forward
- Nominal income refers to an income value that is not adjusted for inflation. Real income adjusts the nominal value for the rate of inflation. Real income per capita is considered a good measure of the buying power of an individual in a particular area because it adjusts for both the number of people in the area and the relative inflation of the area. According to Forbes magazine, the state with the highest annual real income per capita in 2020 is Connecticut with a real per capita income of $68,533. Suppose that the annual real income of individuals in Connecticut follows a normal distribution with a mean of $68,533 and standard deviation of $23,480. (a) What is the probability that an individual in Connecticut has an annual real income of $54,000 or more? (Round your answer to four decimal places.) (b) What is the probability that an individual in Connecticut has an annual real income of $29,000 or less? (Round your answer to four decimal places.) (c) What is the probability…arrow_forwardNominal income refers to an income value that is not adjusted for inflation. Real income adjusts the nominal value for the rate of inflation. Real income per capita is considered a good measure of the buying power of an individual in a particular area because it adjusts for both the number of people in the area and the relative inflation of the area. According to Forbes magazine, the state with the highest annual real income per capita in 2020 is Connecticut with a real per capita income of $68,533. Suppose that the annual real income of individuals in Connecticut follows a normal distribution with a mean of $68,533 and standard deviation of 23.480 a. What is the probability that an individual in Connecticut has an annual real income of $50,000 or more (to 2 decimals)? c. What is the probability that an individual in Connecticut has an annual real income between$60,000 and $80,000 (to 2 decimals)? d. What is the annual real income of a person in the 99th percentile of annual…arrow_forwardplease answer the question in the attached picture with work shown, thanks! #2 A,Barrow_forward
 Algebra: Structure And Method, Book 1AlgebraISBN:9780395977224Author:Richard G. Brown, Mary P. Dolciani, Robert H. Sorgenfrey, William L. ColePublisher:McDougal Littell
 Functions and Change: A Modeling Approach to Coll...AlgebraISBN:9781337111348Author:Bruce Crauder, Benny Evans, Alan NoellPublisher:Cengage Learning
 College Algebra (MindTap Course List)AlgebraISBN:9781305652231Author:R. David Gustafson, Jeff HughesPublisher:Cengage Learning
 Glencoe Algebra 1, Student Edition, 9780079039897...AlgebraISBN:9780079039897Author:CarterPublisher:McGraw Hill
 College AlgebraAlgebraISBN:9781305115545Author:James Stewart, Lothar Redlin, Saleem WatsonPublisher:Cengage Learning