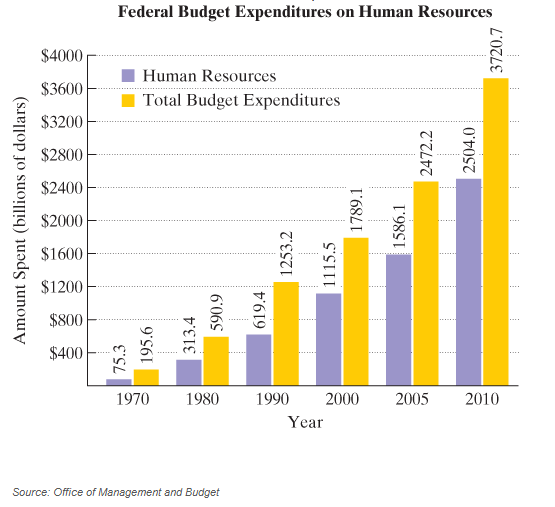
The bar graph shows the amount, in billions of dollars, that the United States government spent on human resources and total budget outlays for six selected years. (Human resources include education, health. Medicare. Social Security and veterans benefits and services.) The function p ( x ) = 1.75 x 2 − 15.9 x + 160 models the amount. p(x), in billions of dollars, that the United States government spent on human resources x years after 1970. The function q ( x ) = 2.1 x 2 − 3.5 x + 296 models total budget expenditures, q ( x ), in billions of dollars, x years after 1970. a. Use p and q to write a rational function that models the fraction of total budget outlays spent on human resources x years after 1970. b. Use the data displayed by the bar graph to find the percentage of federal expenditures spent on human resources in 2010. Round to the nearest percent. c. Use the rational function from part (a) to find the percentage of federal expenditures spent on human resources in 2010. Round to the nearest percent. Does this underestimate or overestimate the actual percent that you found in part (b)? By how much? d. What is the equation of the horizontal asymptote associated with the rational function in part (a)? If trends modeled by the function continue, what percentage of the federal budget will be spent on human resources over time? Round to the nearest percent.
The bar graph shows the amount, in billions of dollars, that the United States government spent on human resources and total budget outlays for six selected years. (Human resources include education, health. Medicare. Social Security and veterans benefits and services.) The function p ( x ) = 1.75 x 2 − 15.9 x + 160 models the amount. p(x), in billions of dollars, that the United States government spent on human resources x years after 1970. The function q ( x ) = 2.1 x 2 − 3.5 x + 296 models total budget expenditures, q ( x ), in billions of dollars, x years after 1970. a. Use p and q to write a rational function that models the fraction of total budget outlays spent on human resources x years after 1970. b. Use the data displayed by the bar graph to find the percentage of federal expenditures spent on human resources in 2010. Round to the nearest percent. c. Use the rational function from part (a) to find the percentage of federal expenditures spent on human resources in 2010. Round to the nearest percent. Does this underestimate or overestimate the actual percent that you found in part (b)? By how much? d. What is the equation of the horizontal asymptote associated with the rational function in part (a)? If trends modeled by the function continue, what percentage of the federal budget will be spent on human resources over time? Round to the nearest percent.
Solution Summary: The author explains that the rational function of the provided model is p(x)=1.75x
The bar graph shows the amount, in billions of dollars, that the United States government spent on human resources and total budget outlays for six selected years. (Human resources include education, health. Medicare. Social Security and veterans benefits and services.)
The function
p
(
x
)
=
1.75
x
2
−
15.9
x
+
160
models the amount. p(x), in billions of dollars, that the United States government spent on human resources x years after 1970. The function
q
(
x
)
=
2.1
x
2
−
3.5
x
+
296
models total budget expenditures, q (x ), in billions of dollars, x years after 1970.
a. Use p and q to write a rational function that models the fraction of total budget outlays spent on human resources x years after 1970.
b. Use the data displayed by the bar graph to find the percentage of federal expenditures spent on human resources in 2010. Round to the nearest percent.
c. Use the rational function from part (a) to find the percentage of federal expenditures spent on human resources in 2010. Round to the nearest percent. Does this underestimate or overestimate the actual percent that you found in part (b)? By how much?
d. What is the equation of the horizontal asymptote associated with the rational function in part (a)? If trends modeled by the function continue, what percentage of the federal budget will be spent on human resources over time? Round to the nearest percent.
Can you answer this question and give step by step and why and how to get it. Can you write it (numerical method)
Can you answer this question and give step by step and why and how to get it. Can you write it (numerical method)
There are three options for investing $1150. The first earns 10% compounded annually, the second earns 10% compounded quarterly, and the third earns 10% compounded continuously. Find equations that model each investment growth and
use a graphing utility to graph each model in the same viewing window over a 20-year period. Use the graph to determine which investment yields the highest return after 20 years. What are the differences in earnings among the three
investment?
STEP 1: The formula for compound interest is
A =
nt
= P(1 + − − ) n²,
where n is the number of compoundings per year, t is the number of years, r is the interest rate, P is the principal, and A is the amount (balance) after t years. For continuous compounding, the formula reduces to
A = Pert
Find r and n for each model, and use these values to write A in terms of t for each case.
Annual Model
r=0.10
A = Y(t) = 1150 (1.10)*
n = 1
Quarterly Model
r = 0.10
n = 4
A = Q(t) = 1150(1.025) 4t
Continuous Model
r=0.10
A = C(t) =…
Need a deep-dive on the concept behind this application? Look no further. Learn more about this topic, calculus and related others by exploring similar questions and additional content below.


 Big Ideas Math A Bridge To Success Algebra 1: Stu...AlgebraISBN:9781680331141Author:HOUGHTON MIFFLIN HARCOURTPublisher:Houghton Mifflin Harcourt
 Holt Mcdougal Larson Pre-algebra: Student Edition...AlgebraISBN:9780547587776Author:HOLT MCDOUGALPublisher:HOLT MCDOUGAL
 Glencoe Algebra 1, Student Edition, 9780079039897...AlgebraISBN:9780079039897Author:CarterPublisher:McGraw Hill

 College Algebra (MindTap Course List)AlgebraISBN:9781305652231Author:R. David Gustafson, Jeff HughesPublisher:Cengage Learning