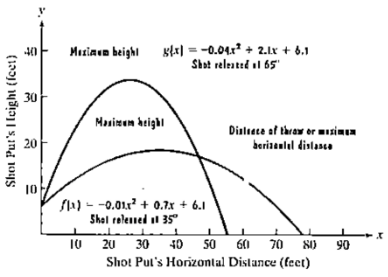
An athlete whose is the shot put releases the shot with the same initial velocity but at different angles. The figure shows the parabolic paths for shots released at angles of 35 ∘ and 65 ∘ , Exercises 57-58 are based on the functions that model the parabolic paths. when the shot whose path is shown by the blue graph is released at an angle of 35 ∘ , its height. F(x), in feet, can be modeled by f ( x ) = − 0.01 x 2 + 0.7 x + 6.1 where x is the shot’s horizontal distance, in feet from its point of release. Use this model to solve parts (a) through (c) and verify yours answers using the blue graph. a. What is the maximum height of the shot and how far from its point of release does this occur? b. What is the shot’s maximum horizontal distance, to the nearest tenth of foot, or the distance of the throw? c. From what height was the shot released?
An athlete whose is the shot put releases the shot with the same initial velocity but at different angles. The figure shows the parabolic paths for shots released at angles of 35 ∘ and 65 ∘ , Exercises 57-58 are based on the functions that model the parabolic paths. when the shot whose path is shown by the blue graph is released at an angle of 35 ∘ , its height. F(x), in feet, can be modeled by f ( x ) = − 0.01 x 2 + 0.7 x + 6.1 where x is the shot’s horizontal distance, in feet from its point of release. Use this model to solve parts (a) through (c) and verify yours answers using the blue graph. a. What is the maximum height of the shot and how far from its point of release does this occur? b. What is the shot’s maximum horizontal distance, to the nearest tenth of foot, or the distance of the throw? c. From what height was the shot released?
Solution Summary: The author explains how to calculate the maximum height of the shot and the distance at which it occurs.
An athlete whose is the shot put releases the shot with the same initial velocity but at different angles. The figure shows the parabolic paths for shots released at angles of
35
∘
and
65
∘
, Exercises 57-58 are based on the functions that model the parabolic paths.
when the shot whose path is shown by the blue graph is released at an angle of
35
∘
, its height. F(x), in feet, can be modeled by
f
(
x
)
=
−
0.01
x
2
+
0.7
x
+
6.1
where x is the shot’s horizontal distance, in feet from its point of release. Use this model to solve parts (a) through (c) and verify yours answers using the blue graph.
a. What is the maximum height of the shot and how far from its point of release does this occur?
b. What is the shot’s maximum horizontal distance, to the nearest tenth of foot, or the distance of the throw?
Can you answer this question and give step by step and why and how to get it. Can you write it (numerical method)
Can you answer this question and give step by step and why and how to get it. Can you write it (numerical method)
There are three options for investing $1150. The first earns 10% compounded annually, the second earns 10% compounded quarterly, and the third earns 10% compounded continuously. Find equations that model each investment growth and
use a graphing utility to graph each model in the same viewing window over a 20-year period. Use the graph to determine which investment yields the highest return after 20 years. What are the differences in earnings among the three
investment?
STEP 1: The formula for compound interest is
A =
nt
= P(1 + − − ) n²,
where n is the number of compoundings per year, t is the number of years, r is the interest rate, P is the principal, and A is the amount (balance) after t years. For continuous compounding, the formula reduces to
A = Pert
Find r and n for each model, and use these values to write A in terms of t for each case.
Annual Model
r=0.10
A = Y(t) = 1150 (1.10)*
n = 1
Quarterly Model
r = 0.10
n = 4
A = Q(t) = 1150(1.025) 4t
Continuous Model
r=0.10
A = C(t) =…
Need a deep-dive on the concept behind this application? Look no further. Learn more about this topic, calculus and related others by exploring similar questions and additional content below.


 Algebra & Trigonometry with Analytic GeometryAlgebraISBN:9781133382119Author:SwokowskiPublisher:Cengage
 Holt Mcdougal Larson Pre-algebra: Student Edition...AlgebraISBN:9780547587776Author:HOLT MCDOUGALPublisher:HOLT MCDOUGAL