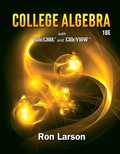
HOW DO YOU SEE IT? Use the graph of y = f x to find the open intervals on which the graph of each transformation is increasing and decreasing. If not possible, state the reason. a y = f − x b y = − f x c y = 1 2 f x d y = − f x − 1 e y = f x − 2 + 1
HOW DO YOU SEE IT? Use the graph of y = f x to find the open intervals on which the graph of each transformation is increasing and decreasing. If not possible, state the reason. a y = f − x b y = − f x c y = 1 2 f x d y = − f x − 1 e y = f x − 2 + 1
HOW DO YOU SEE IT? Use the graph of
y
=
f
x
to find the open intervals on which the graph of each transformation is increasing and decreasing. If not possible, state the reason.
a
y
=
f
−
x
b
y
=
−
f
x
c
y
=
1
2
f
x
d
y
=
−
f
x
−
1
e
y
=
f
x
−
2
+
1
InThe Northern Lights are bright flashes of colored light between 50 and 200 miles above Earth.
Suppose a flash occurs 150 miles above Earth. What is the measure of arc BD, the portion of Earth
from which the flash is visible? (Earth’s radius is approximately 4000 miles.)
e).
n!
(n - 1)!
Suppose you flip a fair two-sided coin four times and record the result.
a). List the sample space of this experiment. That is, list all possible outcomes that could
occur when flipping a fair two-sided coin four total times. Assume the two sides of the coin are
Heads (H) and Tails (T).
Need a deep-dive on the concept behind this application? Look no further. Learn more about this topic, algebra and related others by exploring similar questions and additional content below.
Linear Equation | Solving Linear Equations | What is Linear Equation in one variable ?; Author: Najam Academy;https://www.youtube.com/watch?v=tHm3X_Ta_iE;License: Standard YouTube License, CC-BY


 Algebra & Trigonometry with Analytic GeometryAlgebraISBN:9781133382119Author:SwokowskiPublisher:Cengage
 Glencoe Algebra 1, Student Edition, 9780079039897...AlgebraISBN:9780079039897Author:CarterPublisher:McGraw Hill
 Holt Mcdougal Larson Pre-algebra: Student Edition...AlgebraISBN:9780547587776Author:HOLT MCDOUGALPublisher:HOLT MCDOUGAL
 Big Ideas Math A Bridge To Success Algebra 1: Stu...AlgebraISBN:9781680331141Author:HOUGHTON MIFFLIN HARCOURTPublisher:Houghton Mifflin Harcourt