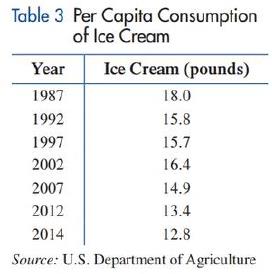
Diet. Table 3 shows the per capita consumption of ice cream in the United States for selected years since 1987 . (A) Let x represent the number of years since 1980 and find a cubic regression polynomial for the per capita consumption of ice cream. (B) Use the polynomial model from part (A) to estimate (to the nearest tenth of a pound) the per capita consumption of ice cream in 2023 .
Diet. Table 3 shows the per capita consumption of ice cream in the United States for selected years since 1987 . (A) Let x represent the number of years since 1980 and find a cubic regression polynomial for the per capita consumption of ice cream. (B) Use the polynomial model from part (A) to estimate (to the nearest tenth of a pound) the per capita consumption of ice cream in 2023 .
Solution Summary: The author calculates the cubic regression using the provided table, where x is the years since year 1980 and y represents per capita consumption of ice cream.
Would you please help with these questions? I don't understand when to choose a bar chart and pie chart, and question 3 , thank you
H.w
WI
M
Wz
A
Sindax
Sind dy max
Утах
at 0.75m from A
w=6KN/M L=2
W2=9 KN/m
P= 10 KN
B
Make the solution handwritten and not
artificial intelligence because I will
give a bad rating if you solve it with
artificial intelligence
2. A microwave manufacturing firm has determined that their profit function is P(x)=-0.0014x+0.3x²+6x-355 , where is the number of microwaves sold annually. a. Graph the profit function using a calculator. b. Determine a reasonable viewing window for the function. c. Approximate all of the zeros of the function using the CALC menu of your calculator. d. What must be the range of microwaves sold in order for the firm to profit?
Need a deep-dive on the concept behind this application? Look no further. Learn more about this topic, subject and related others by exploring similar questions and additional content below.
Correlation Vs Regression: Difference Between them with definition & Comparison Chart; Author: Key Differences;https://www.youtube.com/watch?v=Ou2QGSJVd0U;License: Standard YouTube License, CC-BY
Correlation and Regression: Concepts with Illustrative examples; Author: LEARN & APPLY : Lean and Six Sigma;https://www.youtube.com/watch?v=xTpHD5WLuoA;License: Standard YouTube License, CC-BY


 Glencoe Algebra 1, Student Edition, 9780079039897...AlgebraISBN:9780079039897Author:CarterPublisher:McGraw Hill
 Algebra & Trigonometry with Analytic GeometryAlgebraISBN:9781133382119Author:SwokowskiPublisher:Cengage
 College AlgebraAlgebraISBN:9781305115545Author:James Stewart, Lothar Redlin, Saleem WatsonPublisher:Cengage Learning
 College Algebra (MindTap Course List)AlgebraISBN:9781305652231Author:R. David Gustafson, Jeff HughesPublisher:Cengage Learning