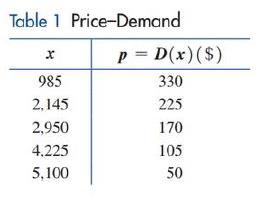
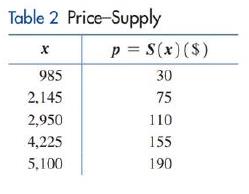
Equilibrium point. A company is planning to introduce a 10-piece set of nonstick cookware. A marketing company established price-demand and price-supply tables for selected prices (Tables 1 and 2 ), where x is the number of cookware sets people are willing to buy and the company is willing to sell each month at a price of p dollars per set. (A) Find a quadratic regression model for the data in Table 1 . Estimate the demand at a price level of $180 . (B) Find a linear regression model for the data in Table 2 . Estimate the supply at a price level of $180 . (C) Does a price level of $180 represent a stable condition, or is the price likely to increase or decrease? Explain. (D) Use the models in parts (A) and (B) to find the equilibrium point. Write the equilibrium price to the nearest cent and the equilibrium quantity to the nearest unit.
Equilibrium point. A company is planning to introduce a 10-piece set of nonstick cookware. A marketing company established price-demand and price-supply tables for selected prices (Tables 1 and 2 ), where x is the number of cookware sets people are willing to buy and the company is willing to sell each month at a price of p dollars per set. (A) Find a quadratic regression model for the data in Table 1 . Estimate the demand at a price level of $180 . (B) Find a linear regression model for the data in Table 2 . Estimate the supply at a price level of $180 . (C) Does a price level of $180 represent a stable condition, or is the price likely to increase or decrease? Explain. (D) Use the models in parts (A) and (B) to find the equilibrium point. Write the equilibrium price to the nearest cent and the equilibrium quantity to the nearest unit.
Solution Summary: The author calculates the quadratic regression model and estimates the demand at a price level of 180 using online graphing utility.
Equilibrium point. A company is planning to introduce a 10-piece set of nonstick cookware. A marketing company established price-demand and price-supply tables for selected prices (Tables
1
and
2
), where
x
is the number of cookware sets people are willing to buy and the company is willing to sell each month at a price of
p
dollars per set.
(A) Find a quadratic regression model for the data in Table
1
. Estimate the demand at a price level of
$180
.
(B) Find a linear regression model for the data in Table
2
. Estimate the supply at a price level of
$180
.
(C) Does a price level of
$180
represent a stable condition, or is the price likely to increase or decrease? Explain.
(D) Use the models in parts (A) and (B) to find the equilibrium point. Write the equilibrium price to the nearest cent and the equilibrium quantity to the nearest unit.
Diagonalize the following matrix, if possible.
8
0
6
- 8
Select the correct choice below and, if necessary, fill in the answer box to complete your choice.
8 0
OA. For P=
D=
0 3
6 0
B. For P =
D=
0
-6
8
0
C.
For P =
D=
0
- 8
D.
The matrix cannot be diagonalized.
Calculus lll
May I please have the solutions for the following exercises?
Thank you
Calculus lll
May I please have the solution for the following question?
Thank you
Need a deep-dive on the concept behind this application? Look no further. Learn more about this topic, subject and related others by exploring similar questions and additional content below.
Correlation Vs Regression: Difference Between them with definition & Comparison Chart; Author: Key Differences;https://www.youtube.com/watch?v=Ou2QGSJVd0U;License: Standard YouTube License, CC-BY
Correlation and Regression: Concepts with Illustrative examples; Author: LEARN & APPLY : Lean and Six Sigma;https://www.youtube.com/watch?v=xTpHD5WLuoA;License: Standard YouTube License, CC-BY


 College AlgebraAlgebraISBN:9781305115545Author:James Stewart, Lothar Redlin, Saleem WatsonPublisher:Cengage Learning
 Algebra and Trigonometry (MindTap Course List)AlgebraISBN:9781305071742Author:James Stewart, Lothar Redlin, Saleem WatsonPublisher:Cengage Learning
 Glencoe Algebra 1, Student Edition, 9780079039897...AlgebraISBN:9780079039897Author:CarterPublisher:McGraw Hill
 Algebra & Trigonometry with Analytic GeometryAlgebraISBN:9781133382119Author:SwokowskiPublisher:Cengage