
Modern Business Statistics with Microsoft Excel (MindTap Course List)
5th Edition
ISBN: 9781285433301
Author: David R. Anderson, Dennis J. Sweeney, Thomas A. Williams
Publisher: Cengage Learning
expand_more
expand_more
format_list_bulleted
Concept explainers
Videos
Textbook Question
Chapter 2.4, Problem 42E
Smartphones are mobile phones with Internet, photo, music, and video capability. The following survey results show smartphone ownership by age.
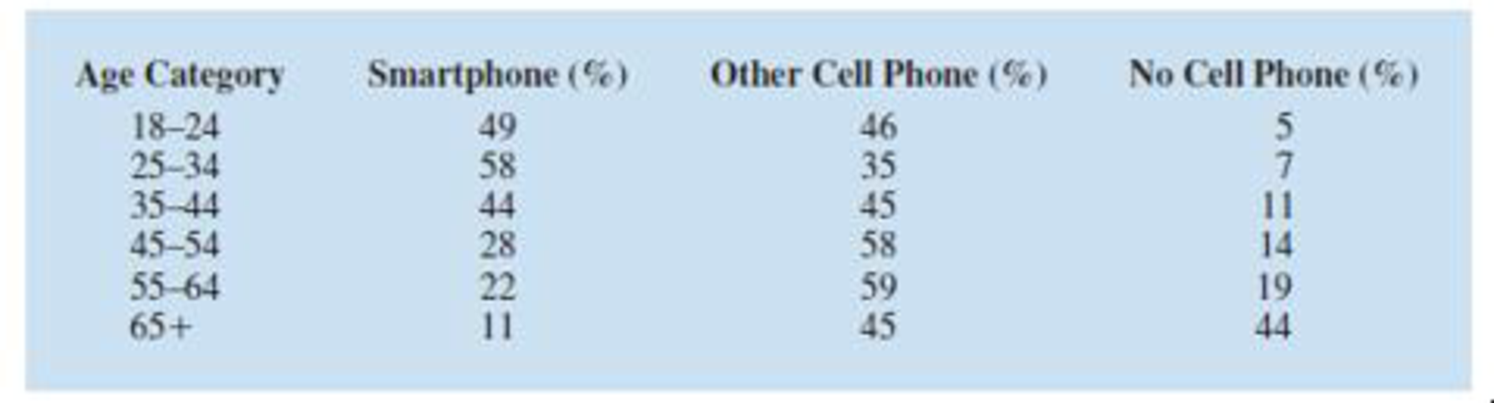
- a. Construct a stacked bar chart to display the above survey data on type of mobile phone ownership. Use age category as the variable on the horizontal axis.
- b. Comment on the relationship between age and smartphone ownership.
- c. How would you expect the results of this survey to be different if conducted in 2021?
Expert Solution & Answer
Want to see the full answer?
Check out a sample textbook solution
Students have asked these similar questions
The average miles per gallon for a sample of 40 cars of model SX last year was 32.1, with a population standard deviation of 3.8. A sample of 40 cars from this year’s model SX has an average of 35.2 mpg, with a population standard deviation of 5.4.
Find a 99 percent confidence interval for the difference in average mpg for this car brand (this year’s model minus last year’s).Find a 99 percent confidence interval for the difference in average mpg for last year’s model minus this year’s. What does the negative difference mean?
A special interest group reports a tiny margin of error (plus or minus 0.04 percent) for its online survey based on 50,000 responses. Is the margin of error legitimate? (Assume that the group’s math is correct.)
Suppose that 73 percent of a sample of 1,000 U.S. college students drive a used car as opposed to a new car or no car at all.
Find an 80 percent confidence interval for the percentage of all U.S. college students who drive a used car.What sample size would cut this margin of error in half?
Chapter 2 Solutions
Modern Business Statistics with Microsoft Excel (MindTap Course List)
Ch. 2.1 - Methods
1. The response to a question has three...Ch. 2.1 - 2. A partial relative frequency distribution is...Ch. 2.1 - A questionnaire provides 58 Yes, 42 No, and 20...Ch. 2.1 -
For the 2010–2011 viewing season, the top five...Ch. 2.1 -
In alphabetical order, the six most common last...Ch. 2.1 - Top Rated Television Show Networks. Nielsen Media...Ch. 2.1 - Airline Customer Satisfaction Survey. Many...Ch. 2.1 - Prob. 8ECh. 2.1 - Prob. 9ECh. 2.1 -
VirtualTourist provides ratings for hotels...
Ch. 2.2 - 11. Consider the following data.
Develop a...Ch. 2.2 - 12. Consider the following frequency...Ch. 2.2 - Construct a histogram for the data in exercise...Ch. 2.2 - Prob. 14ECh. 2.2 - Construct a stem-and-leaf display for the...Ch. 2.2 - Construct a stem-and-leaf display for the...Ch. 2.2 - Applications
17. A doctor’s office staff studied...Ch. 2.2 - NBA Total Player Ratings. CBSSports.com developed...Ch. 2.2 - CEO Time in Meetings. The London School of...Ch. 2.2 - Prob. 21ECh. 2.2 - Top U.S. Franchises. Entrepreneur magazine ranks...Ch. 2.2 - Prob. 23ECh. 2.2 - Prob. 24ECh. 2.2 - Prob. 25ECh. 2.2 - Prob. 26ECh. 2.3 - The following data are for 30 observations...Ch. 2.3 - The following observations are for two...Ch. 2.3 - Prob. 29ECh. 2.3 - Refer again to the crosstabulation of household...Ch. 2.3 - 31. Recently, management at Oak Tree Golf Course...Ch. 2.3 -
Table 2.12 shows a data set containing...Ch. 2.3 - Prob. 33ECh. 2.3 - Prob. 34ECh. 2.3 -
The U.S. Department of Energy's Fuel Economy...Ch. 2.4 - The following 20 observations are for two...Ch. 2.4 - Prob. 37ECh. 2.4 - The following crosstabulation summarizes the data...Ch. 2.4 - Driving Speed and Fuel Efficiency. A study on...Ch. 2.4 - Prob. 40ECh. 2.4 - Hypertension and Heart Disease. People often wait...Ch. 2.4 -
Smartphones are mobile phones with Internet,...Ch. 2.4 - Store Managers Time Study. The Northwest regional...Ch. 2 - SAT Scores. The SAT is a standardized test used by...Ch. 2 - Prob. 45SECh. 2 - State Populations. Data showing the population by...Ch. 2 - Startup Company Funds. According to the Wall...Ch. 2 - Complaints Reported to BBB. Consumer complaints...Ch. 2 - Prob. 49SECh. 2 - Prob. 50SECh. 2 - Prob. 51SECh. 2 - Best Places to Work. Fortune magazine publishes an...Ch. 2 - Prob. 53SECh. 2 - Prob. 54SECh. 2 - Prob. 55SECh. 2 - Prob. 56SECh. 2 -
Google has changed its strategy with regard to...Ch. 2 -
A zoo has categorized its visitors into three...Ch. 2 - Pelican Stores, a division of National Clothing,...Ch. 2 -
Motion Picture Industry
The motion picture...
Knowledge Booster


Learn more about
Need a deep-dive on the concept behind this application? Look no further. Learn more about this topic, statistics and related others by exploring similar questions and additional content below.Similar questions
- You want to compare the average number of tines on the antlers of male deer in two nearby metro parks. A sample of 30 deer from the first park shows an average of 5 tines with a population standard deviation of 3. A sample of 35 deer from the second park shows an average of 6 tines with a population standard deviation of 3.2. Find a 95 percent confidence interval for the difference in average number of tines for all male deer in the two metro parks (second park minus first park).Do the parks’ deer populations differ in average size of deer antlers?arrow_forwardSuppose that you want to increase the confidence level of a particular confidence interval from 80 percent to 95 percent without changing the width of the confidence interval. Can you do it?arrow_forwardA random sample of 1,117 U.S. college students finds that 729 go home at least once each term. Find a 98 percent confidence interval for the proportion of all U.S. college students who go home at least once each term.arrow_forward
- Suppose that you make two confidence intervals with the same data set — one with a 95 percent confidence level and the other with a 99.7 percent confidence level. Which interval is wider?Is a wide confidence interval a good thing?arrow_forwardIs it true that a 95 percent confidence interval means you’re 95 percent confident that the sample statistic is in the interval?arrow_forwardTines can range from 2 to upwards of 50 or more on a male deer. You want to estimate the average number of tines on the antlers of male deer in a nearby metro park. A sample of 30 deer has an average of 5 tines, with a population standard deviation of 3. Find a 95 percent confidence interval for the average number of tines for all male deer in this metro park.Find a 98 percent confidence interval for the average number of tines for all male deer in this metro park.arrow_forward
- Based on a sample of 100 participants, the average weight loss the first month under a new (competing) weight-loss plan is 11.4 pounds with a population standard deviation of 5.1 pounds. The average weight loss for the first month for 100 people on the old (standard) weight-loss plan is 12.8 pounds, with population standard deviation of 4.8 pounds. Find a 90 percent confidence interval for the difference in weight loss for the two plans( old minus new) Whats the margin of error for your calculated confidence interval?arrow_forwardA 95 percent confidence interval for the average miles per gallon for all cars of a certain type is 32.1, plus or minus 1.8. The interval is based on a sample of 40 randomly selected cars. What units represent the margin of error?Suppose that you want to decrease the margin of error, but you want to keep 95 percent confidence. What should you do?arrow_forward3. (i) Below is the R code for performing a X2 test on a 2×3 matrix of categorical variables called TestMatrix: chisq.test(Test Matrix) (a) Assuming we have a significant result for this procedure, provide the R code (including any required packages) for an appropriate post hoc test. (b) If we were to apply this technique to a 2 × 2 case, how would we adapt the code in order to perform the correct test? (ii) What procedure can we use if we want to test for association when we have ordinal variables? What code do we use in R to do this? What package does this command belong to? (iii) The following code contains the initial steps for a scenario where we are looking to investigate the relationship between age and whether someone owns a car by using frequencies. There are two issues with the code - please state these. Row3<-c(75,15) Row4<-c(50,-10) MortgageMatrix<-matrix(c(Row1, Row4), byrow=T, nrow=2, MortgageMatrix dimnames=list(c("Yes", "No"), c("40 or older","<40")))…arrow_forward
- Describe the situation in which Fisher’s exact test would be used?(ii) When do we use Yates’ continuity correction (with respect to contingencytables)?[2 Marks] 2. Investigate, checking the relevant assumptions, whether there is an associationbetween age group and home ownership based on the sample dataset for atown below:Home Owner: Yes NoUnder 40 39 12140 and over 181 59Calculate and evaluate the effect size.arrow_forwardNot use ai pleasearrow_forwardNeed help with the following statistic problems.arrow_forward
arrow_back_ios
SEE MORE QUESTIONS
arrow_forward_ios
Recommended textbooks for you
 Big Ideas Math A Bridge To Success Algebra 1: Stu...AlgebraISBN:9781680331141Author:HOUGHTON MIFFLIN HARCOURTPublisher:Houghton Mifflin Harcourt
 Glencoe Algebra 1, Student Edition, 9780079039897...AlgebraISBN:9780079039897Author:CarterPublisher:McGraw Hill
 Holt Mcdougal Larson Pre-algebra: Student Edition...AlgebraISBN:9780547587776Author:HOLT MCDOUGALPublisher:HOLT MCDOUGAL
 Functions and Change: A Modeling Approach to Coll...AlgebraISBN:9781337111348Author:Bruce Crauder, Benny Evans, Alan NoellPublisher:Cengage Learning
Big Ideas Math A Bridge To Success Algebra 1: Stu...
Algebra
ISBN:9781680331141
Author:HOUGHTON MIFFLIN HARCOURT
Publisher:Houghton Mifflin Harcourt
Glencoe Algebra 1, Student Edition, 9780079039897...
Algebra
ISBN:9780079039897
Author:Carter
Publisher:McGraw Hill
Holt Mcdougal Larson Pre-algebra: Student Edition...
Algebra
ISBN:9780547587776
Author:HOLT MCDOUGAL
Publisher:HOLT MCDOUGAL
Functions and Change: A Modeling Approach to Coll...
Algebra
ISBN:9781337111348
Author:Bruce Crauder, Benny Evans, Alan Noell
Publisher:Cengage Learning
The Shape of Data: Distributions: Crash Course Statistics #7; Author: CrashCourse;https://www.youtube.com/watch?v=bPFNxD3Yg6U;License: Standard YouTube License, CC-BY
Shape, Center, and Spread - Module 20.2 (Part 1); Author: Mrmathblog;https://www.youtube.com/watch?v=COaid7O_Gag;License: Standard YouTube License, CC-BY
Shape, Center and Spread; Author: Emily Murdock;https://www.youtube.com/watch?v=_YyW0DSCzpM;License: Standard Youtube License