
Concept explainers
Videos
a.
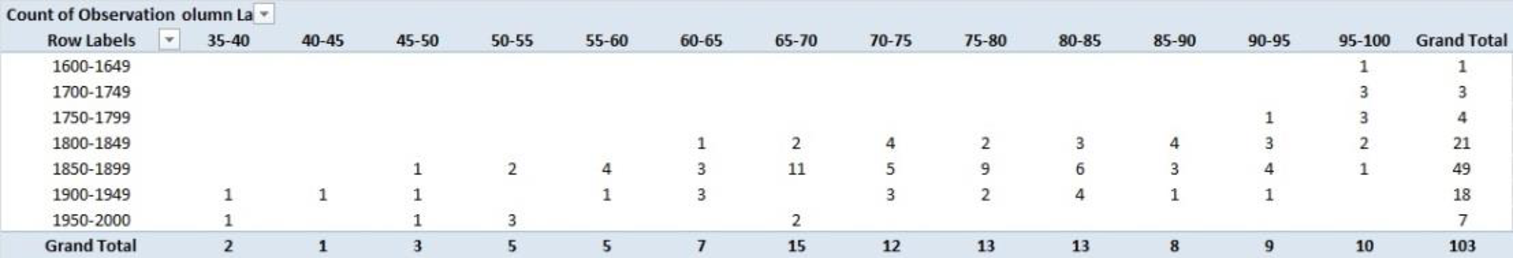
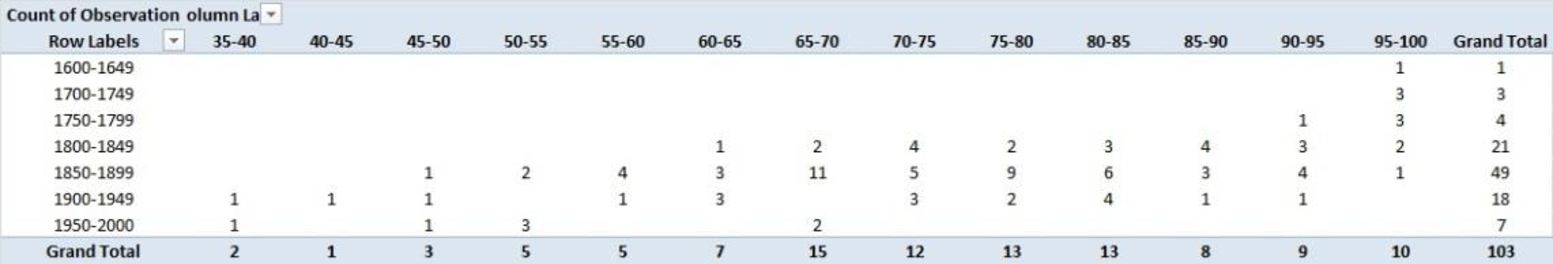
Construct a cross tabulation with Year founded and % Graduate.
a.
Answer to Problem 54SE
The cross tabulation with Year founded and % Graduate is given below.
Explanation of Solution
Calculation:
The given data represents sample of 103 private colleges and universities.
The cross tabulation for the data on Year founded as row variable and % Graduate as the column variable is computed below.
Software procedure:
Step-by-step procedure to develop a cross tabulation using EXCEL:
- Select Insert > Tables > PivotTable.
- In Create PivotTable, select Table/
Range and click Ok. - In PivotTable Fields, drag Year founded to ROWS, % Graduate to COLUMNS, and observations to VALUES.
- Click on Sum of Observations > Value field settings.
- In Value Field Settings, select Count under Summarize value field by.
- Click OK.
- Right click on any of the row variables and select Group.
- In Grouping, give 1,600 in Starting at, 2,000 in Ending at, and 50 in By.
- Click Ok.
- Right click on any of the column variables and select Group.
- In Grouping, give 35 in Starting at, 100 in Ending at, and 5 in By.
- Click Ok.
The EXCEL output is given below:
b.
Compute row percentages for the cross tabulation obtained in Part (a).
b.
Answer to Problem 54SE
The row percentages for the cross tabulation in Part (a) is given below.
| Year founded | 35–40 | 40–45 | 45–50 | 50–55 | 55–60 | 60–65 | 65–70 |
| 1600–1649 | 0 | 0 | 0 | 0 | 0 | 0 | 0 |
| 1700–1749 | 0 | 0 | 0 | 0 | 0 | 0 | 0 |
| 1750–1799 | 0 | 0 | 0 | 0 | 0 | 0 | 0 |
| 1800–1849 | 0 | 0 | 0 | 0 | 0 | 4.76 | 9.52 |
| 1850–1899 | 0 | 0 | 2.04 | 4.08 | 8.16 | 6.12 | 22.45 |
| 1900–1949 | 5.56 | 5.56 | 5.56 | 0 | 5.56 | 16.67 | 0 |
| 1950–2000 | 14.29 | 0 | 14.29 | 42.86 | 0 | 0 | 28.57 |
| Year founded | 70–75 | 75–80 | 80–85 | 85–90 | 90–95 | 95–100 | Total |
| 1600–1649 | 0 | 0 | 0 | 0 | 0 | 100 | 100 |
| 1700–1749 | 0 | 0 | 0 | 0 | 0 | 100 | 100 |
| 1750–1799 | 0 | 0 | 0 | 0 | 25 | 75 | 100 |
| 1800–1849 | 19.05 | 9.52 | 14.29 | 19.05 | 14.29 | 9.52 | 100 |
| 1850–1899 | 10.2 | 18.37 | 12.24 | 6.12 | 8.16 | 2.04 | 100 |
| 1900–1949 | 16.67 | 11.11 | 22.22 | 5.56 | 5.56 | 0 | 100 |
| 1950–2000 | 0 | 0 | 0 | 0 | 0 | 0 | 100 |
Explanation of Solution
Calculation:
Dividing each frequency by its row margin and multiplying it with 100 gives row percentages.
The row percentage for the cross tabulation in Part (a) is calculated below.
| Year founded | 35–40 | 40–45 | 45–50 | 50–55 | 55–60 | 60–65 | 65–70 |
| 1600–1649 | |||||||
| 1700–1749 | |||||||
| 1750–1799 | |||||||
| 1800–1849 | |||||||
| 1850–1899 | |||||||
| 1900–1949 | |||||||
| 1950–2000 |
| Year founded | 70–75 | 75–80 | 80–85 | 85–90 | 90–95 | 95–100 | Total |
| 1600–1649 | 100 | ||||||
| 1700–1749 | 100 | ||||||
| 1750–1799 | 100 | ||||||
| 1800–1849 | 100 | ||||||
| 1850–1899 | 100 | ||||||
| 1900–1949 | 100 | ||||||
| 1950–2000 | 100 |
c.
Write about the relationship between year founded and % Graduate.
c.
Explanation of Solution
From the row percentage frequencies in Part (b), it is observed that the higher percentage graduates are associated with the colleges that are founded before 1800.
Thus, in the sample, it can be said that older colleges and universities tend to have higher percentage of graduation.
Want to see more full solutions like this?
Chapter 2 Solutions
Modern Business Statistics with Microsoft Excel (MindTap Course List)


- Given your fitted regression line, what would be the residual for snake #5 (10 C)?arrow_forwardCalculate the 95% confidence interval around your estimate of r using Fisher’s z-transformation. In your final answer, make sure to back-transform to the original units.arrow_forwardCalculate Pearson’s correlation coefficient (r) between temperature and heart rate.arrow_forward
- A researcher wishes to estimate, with 90% confidence, the population proportion of adults who support labeling legislation for genetically modified organisms (GMOs). Her estimate must be accurate within 4% of the true proportion. (a) No preliminary estimate is available. Find the minimum sample size needed. (b) Find the minimum sample size needed, using a prior study that found that 65% of the respondents said they support labeling legislation for GMOs. (c) Compare the results from parts (a) and (b). ... (a) What is the minimum sample size needed assuming that no prior information is available? n = (Round up to the nearest whole number as needed.)arrow_forwardThe table available below shows the costs per mile (in cents) for a sample of automobiles. At a = 0.05, can you conclude that at least one mean cost per mile is different from the others? Click on the icon to view the data table. Let Hss, HMS, HLS, Hsuv and Hмy represent the mean costs per mile for small sedans, medium sedans, large sedans, SUV 4WDs, and minivans respectively. What are the hypotheses for this test? OA. Ho: Not all the means are equal. Ha Hss HMS HLS HSUV HMV B. Ho Hss HMS HLS HSUV = μMV Ha: Hss *HMS *HLS*HSUV * HMV C. Ho Hss HMS HLS HSUV =μMV = = H: Not all the means are equal. D. Ho Hss HMS HLS HSUV HMV Ha Hss HMS HLS =HSUV = HMVarrow_forwardQuestion: A company launches two different marketing campaigns to promote the same product in two different regions. After one month, the company collects the sales data (in units sold) from both regions to compare the effectiveness of the campaigns. The company wants to determine whether there is a significant difference in the mean sales between the two regions. Perform a two sample T-test You can provide your answer by inserting a text box and the answer must include: Null hypothesis, Alternative hypothesis, Show answer (output table/summary table), and Conclusion based on the P value. (2 points = 0.5 x 4 Answers) Each of these is worth 0.5 points. However, showing the calculation is must. If calculation is missing, the whole answer won't get any credit.arrow_forward
 Glencoe Algebra 1, Student Edition, 9780079039897...AlgebraISBN:9780079039897Author:CarterPublisher:McGraw Hill
 Holt Mcdougal Larson Pre-algebra: Student Edition...AlgebraISBN:9780547587776Author:HOLT MCDOUGALPublisher:HOLT MCDOUGAL
 Functions and Change: A Modeling Approach to Coll...AlgebraISBN:9781337111348Author:Bruce Crauder, Benny Evans, Alan NoellPublisher:Cengage Learning