
Statistics for Business & Economics, Revised (MindTap Course List)
12th Edition
ISBN: 9781285846323
Author: David R. Anderson, Dennis J. Sweeney, Thomas A. Williams, Jeffrey D. Camm, James J. Cochran
Publisher: South-Western College Pub
expand_more
expand_more
format_list_bulleted
Concept explainers
Videos
Textbook Question
Chapter 2.4, Problem 36E
The following 20 observations are for two quantitative variables, x and y.
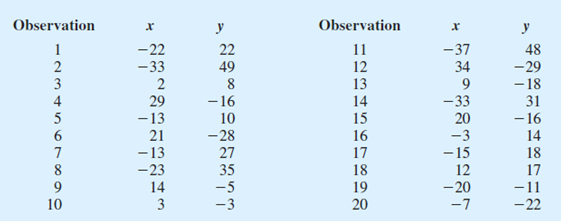
- a. Develop a
scatter diagram for the relationship between x and y. - b. What is the relationship, if any, between x and y?
Expert Solution & Answer

Trending nowThis is a popular solution!

Students have asked these similar questions
A well-known company predominantly makes flat pack furniture for students. Variability with the automated machinery means the wood components are cut with a standard deviation in length of 0.45 mm. After they are cut the components are measured. If their length is more than 1.2 mm from the required length, the components are rejected.
a) Calculate the percentage of components that get rejected.
b) In a manufacturing run of 1000 units, how many are expected to be rejected?
c) The company wishes to install more accurate equipment in order to reduce the rejection rate by one-half, using the same ±1.2mm rejection criterion. Calculate the maximum acceptable standard deviation of the new process.
5. Let X and Y be independent random variables and let the superscripts denote
symmetrization (recall Sect. 3.6). Show that
(X + Y) X+ys.
8. Suppose that the moments of the random variable X are constant, that is, suppose
that EX" =c for all n ≥ 1, for some constant c. Find the distribution of X.
Chapter 2 Solutions
Statistics for Business & Economics, Revised (MindTap Course List)
Ch. 2.1 - Methods 1. The response to a question has three...Ch. 2.1 - A partial relative frequency distribution is...Ch. 2.1 - A questionnaire provides 58 Yes, 42 No, and 20...Ch. 2.1 - for the 20102011 viewing season, the top five...Ch. 2.1 - In alphabetical order, the six most common last...Ch. 2.1 - Nielsen Media Research provided the list of the 25...Ch. 2.1 - The Canmark Research Center Airport Customer...Ch. 2.1 - Data for a sample of 55 members of the Baseball...Ch. 2.1 - The Pew Research Centers Social Demographic...Ch. 2.1 - The Financial Times/Harris Poll is a monthly...
Ch. 2.2 - Consider the following data. a. Develop a...Ch. 2.2 - Consider the following frequency distribution....Ch. 2.2 - Construct a histogram for the data in exercise 12.Ch. 2.2 - Consider the following data. a. Construct a dot...Ch. 2.2 - Construct a stem-and-leaf display for the...Ch. 2.2 - Construct a stem-and-leaf display for the...Ch. 2.2 - Applications A doctors office staff studied the...Ch. 2.2 - A shortage of candidates has required school...Ch. 2.2 - The London School of Economics and the Harvard...Ch. 2.2 - Fortune provides a list of Americas largest...Ch. 2.2 - entrepreneur magazine ranks franchises using...Ch. 2.2 - The Nielsen Home Technology Report provided...Ch. 2.2 - Prob. 24ECh. 2.2 - A psychologist developed a new test of adult...Ch. 2.2 - The 2011 Cincinnati Flying Pig Half-Marathon (13.1...Ch. 2.3 - The following data are for 30 observations...Ch. 2.3 - The following observations are for two...Ch. 2.3 - The following crosstabulation shows household...Ch. 2.3 - Refer again to the crosstabulation of household...Ch. 2.3 - Recently, management at Oak Tree Golf Course...Ch. 2.3 - Table 2.12 shows a data set containing information...Ch. 2.3 - Refer to the data in Table 2.12. a. Prepare a...Ch. 2.3 - Refer to the data in Table 2.12. a. Prepare a...Ch. 2.3 - The U.S. Department of Energys Fuel Economy Guide...Ch. 2.4 - The following 20 observations are for two...Ch. 2.4 - Consider the following data on two categorical...Ch. 2.4 - The following crosstabulation summarizes the data...Ch. 2.4 - A study on driving speed (miles per hour) and fuel...Ch. 2.4 - The Current Results website lists the average...Ch. 2.4 - People often wait until middle age to worry about...Ch. 2.4 - Smartphones are advanced mobile phones with...Ch. 2.4 - The Northwest regional manager of an outdoor...Ch. 2 - Approximately 1.5 million high school students...Ch. 2 - The Pittsburgh Steelers defeated the Arizona...Ch. 2 - Data showing the population by state in millions...Ch. 2 - A startup companys ability to gain funding is a...Ch. 2 - Consumer complaints are frequently reported to the...Ch. 2 - Dividend yield is the annual dividend paid by a...Ch. 2 - One of the questions in a Financial Times/Harris...Ch. 2 - western University has only one womens softball...Ch. 2 - A survey of commercial buildings served by the...Ch. 2 - Table 2.18 shows a portion of the data for a...Ch. 2 - Refer to the data set in Table 2.18. a. Construct...Ch. 2 - Refer to the data set in Table 2.18. a. Construct...Ch. 2 - Refer to the data set in Table 2.18. a. Prepare a...Ch. 2 - Google has changed its strategy with regard to how...Ch. 2 - A zoo has categorized its visitors into three...Ch. 2 - Pelican Stores Pelican Stores, a division of...Ch. 2 - Motion Picture Industry The motion picture...
Knowledge Booster


Learn more about
Need a deep-dive on the concept behind this application? Look no further. Learn more about this topic, statistics and related others by exploring similar questions and additional content below.Similar questions
- 9. The concentration function of a random variable X is defined as Qx(h) = sup P(x ≤ X ≤x+h), h>0. Show that, if X and Y are independent random variables, then Qx+y (h) min{Qx(h). Qr (h)).arrow_forward10. Prove that, if (t)=1+0(12) as asf->> O is a characteristic function, then p = 1.arrow_forward9. The concentration function of a random variable X is defined as Qx(h) sup P(x ≤x≤x+h), h>0. (b) Is it true that Qx(ah) =aQx (h)?arrow_forward
- 3. Let X1, X2,..., X, be independent, Exp(1)-distributed random variables, and set V₁₁ = max Xk and W₁ = X₁+x+x+ Isk≤narrow_forward7. Consider the function (t)=(1+|t|)e, ER. (a) Prove that is a characteristic function. (b) Prove that the corresponding distribution is absolutely continuous. (c) Prove, departing from itself, that the distribution has finite mean and variance. (d) Prove, without computation, that the mean equals 0. (e) Compute the density.arrow_forward1. Show, by using characteristic, or moment generating functions, that if fx(x) = ½ex, -∞0 < x < ∞, then XY₁ - Y2, where Y₁ and Y2 are independent, exponentially distributed random variables.arrow_forward
- 1. Show, by using characteristic, or moment generating functions, that if 1 fx(x): x) = ½exarrow_forward1990) 02-02 50% mesob berceus +7 What's the probability of getting more than 1 head on 10 flips of a fair coin?arrow_forward9. The concentration function of a random variable X is defined as Qx(h) sup P(x≤x≤x+h), h>0. = x (a) Show that Qx+b(h) = Qx(h).arrow_forward
- Suppose that you buy a lottery ticket, and you have to pick six numbers from 1 through 50 (repetitions allowed). Which combination is more likely to win: 13, 48, 17, 22, 6, 39 or 1, 2, 3, 4, 5, 6? barrow_forward2 Make a histogram from this data set of test scores: 72, 79, 81, 80, 63, 62, 89, 99, 50, 78, 87, 97, 55, 69, 97, 87, 88, 99, 76, 78, 65, 77, 88, 90, and 81. Would a pie chart be appropriate for this data? ganizing Quantitative Data: Charts and Graphs 45arrow_forward10 Meteorologists use computer models to predict when and where a hurricane will hit shore. Suppose they predict that hurricane Stat has a 20 percent chance of hitting the East Coast. a. On what info are the meteorologists basing this prediction? b. Why is this prediction harder to make than your chance of getting a head on your next coin toss? U anoiaarrow_forward
arrow_back_ios
SEE MORE QUESTIONS
arrow_forward_ios
Recommended textbooks for you
 Functions and Change: A Modeling Approach to Coll...AlgebraISBN:9781337111348Author:Bruce Crauder, Benny Evans, Alan NoellPublisher:Cengage Learning
 Big Ideas Math A Bridge To Success Algebra 1: Stu...AlgebraISBN:9781680331141Author:HOUGHTON MIFFLIN HARCOURTPublisher:Houghton Mifflin Harcourt
 Glencoe Algebra 1, Student Edition, 9780079039897...AlgebraISBN:9780079039897Author:CarterPublisher:McGraw Hill
 Holt Mcdougal Larson Pre-algebra: Student Edition...AlgebraISBN:9780547587776Author:HOLT MCDOUGALPublisher:HOLT MCDOUGAL
 Trigonometry (MindTap Course List)TrigonometryISBN:9781337278461Author:Ron LarsonPublisher:Cengage Learning
Functions and Change: A Modeling Approach to Coll...
Algebra
ISBN:9781337111348
Author:Bruce Crauder, Benny Evans, Alan Noell
Publisher:Cengage Learning
Big Ideas Math A Bridge To Success Algebra 1: Stu...
Algebra
ISBN:9781680331141
Author:HOUGHTON MIFFLIN HARCOURT
Publisher:Houghton Mifflin Harcourt
Glencoe Algebra 1, Student Edition, 9780079039897...
Algebra
ISBN:9780079039897
Author:Carter
Publisher:McGraw Hill
Holt Mcdougal Larson Pre-algebra: Student Edition...
Algebra
ISBN:9780547587776
Author:HOLT MCDOUGAL
Publisher:HOLT MCDOUGAL
Trigonometry (MindTap Course List)
Trigonometry
ISBN:9781337278461
Author:Ron Larson
Publisher:Cengage Learning
Correlation Vs Regression: Difference Between them with definition & Comparison Chart; Author: Key Differences;https://www.youtube.com/watch?v=Ou2QGSJVd0U;License: Standard YouTube License, CC-BY
Correlation and Regression: Concepts with Illustrative examples; Author: LEARN & APPLY : Lean and Six Sigma;https://www.youtube.com/watch?v=xTpHD5WLuoA;License: Standard YouTube License, CC-BY