Concept explainers
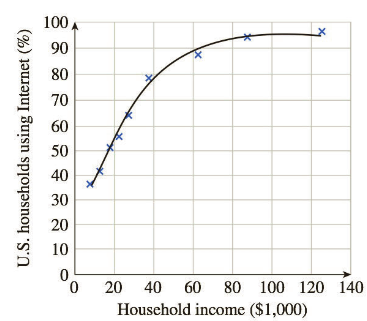
Internet Use The following graph shows the percentage of U.S. households using the Internet at home in 2010 as a function of household income (the data points) and a logistic model of these data (the curve).49

The logistic model is
a. According to the model, what percentage of extremely wealthy households used the Internet?
b. For low incomes the logistic model is approximately exponential. Which exponential model best approximates
c. According to the model, 50% of households of what income used the Internet in 2010? (Round the answer to the nearest $1,000.)
Trending nowThis is a popular solution!

Chapter 2 Solutions
Finite Mathematics and Applied Calculus (MindTap Course List)
- Draw the asymptotes (if there are any). Then plot two points on each piece of the graph.arrow_forwardCancel Done RESET Suppose that R(x) is a polynomial of degree 7 whose coefficients are real numbers. Also, suppose that R(x) has the following zeros. -1-4i, -3i, 5+i Answer the following. (a) Find another zero of R(x). ☐ | | | | |│ | | | -1 བ ¢ Live Adjust Filters Croparrow_forwardSuppose that R (x) is a polynomial of degree 7 whose coefficients are real numbers. Also, suppose that R (x) has the following zeros. -1-4i, -3i, 5+i Answer the following. (c) What is the maximum number of nonreal zeros that R (x) can have? ☐arrow_forward
- Suppose that R (x) is a polynomial of degree 7 whose coefficients are real numbers. Also, suppose that R (x) has the following zeros. -1-4i, -3i, 5+i Answer the following. (b) What is the maximum number of real zeros that R (x) can have? ☐arrow_forwardi need help please dont use chat gptarrow_forward3.1 Limits 1. If lim f(x)=-6 and lim f(x)=5, then lim f(x). Explain your choice. x+3° x+3* x+3 (a) Is 5 (c) Does not exist (b) is 6 (d) is infinitearrow_forward
- 1 pts Let F and G be vector fields such that ▼ × F(0, 0, 0) = (0.76, -9.78, 3.29), G(0, 0, 0) = (−3.99, 6.15, 2.94), and G is irrotational. Then sin(5V (F × G)) at (0, 0, 0) is Question 1 -0.246 0.072 -0.934 0.478 -0.914 -0.855 0.710 0.262 .arrow_forward2. Answer the following questions. (A) [50%] Given the vector field F(x, y, z) = (x²y, e", yz²), verify the differential identity Vx (VF) V(V •F) - V²F (B) [50%] Remark. You are confined to use the differential identities. Let u and v be scalar fields, and F be a vector field given by F = (Vu) x (Vv) (i) Show that F is solenoidal (or incompressible). (ii) Show that G = (uvv – vVu) is a vector potential for F.arrow_forwardA driver is traveling along a straight road when a buffalo runs into the street. This driver has a reaction time of 0.75 seconds. When the driver sees the buffalo he is traveling at 44 ft/s, his car can decelerate at 2 ft/s^2 when the brakes are applied. What is the stopping distance between when the driver first saw the buffalo, to when the car stops.arrow_forward
- Topic 2 Evaluate S x dx, using u-substitution. Then find the integral using 1-x2 trigonometric substitution. Discuss the results! Topic 3 Explain what an elementary anti-derivative is. Then consider the following ex integrals: fed dx x 1 Sdx In x Joseph Liouville proved that the first integral does not have an elementary anti- derivative Use this fact to prove that the second integral does not have an elementary anti-derivative. (hint: use an appropriate u-substitution!)arrow_forward1. Given the vector field F(x, y, z) = -xi, verify the relation 1 V.F(0,0,0) = lim 0+ volume inside Se ff F• Nds SE where SE is the surface enclosing a cube centred at the origin and having edges of length 2€. Then, determine if the origin is sink or source.arrow_forward4 3 2 -5 4-3 -2 -1 1 2 3 4 5 12 23 -4 The function graphed above is: Increasing on the interval(s) Decreasing on the interval(s)arrow_forward

 Functions and Change: A Modeling Approach to Coll...AlgebraISBN:9781337111348Author:Bruce Crauder, Benny Evans, Alan NoellPublisher:Cengage LearningAlgebra & Trigonometry with Analytic GeometryAlgebraISBN:9781133382119Author:SwokowskiPublisher:Cengage
 College AlgebraAlgebraISBN:9781305115545Author:James Stewart, Lothar Redlin, Saleem WatsonPublisher:Cengage Learning
 Glencoe Algebra 1, Student Edition, 9780079039897...AlgebraISBN:9780079039897Author:CarterPublisher:McGraw Hill
 Algebra and Trigonometry (MindTap Course List)AlgebraISBN:9781305071742Author:James Stewart, Lothar Redlin, Saleem WatsonPublisher:Cengage Learning


