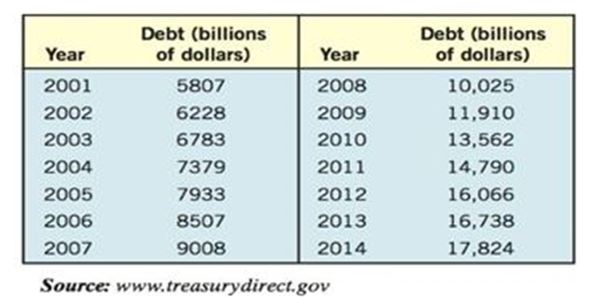
82. National Debt The size of the total debt owed by the United States federal government continues to grow. In fact, according to the Department of the Treasury, the debt per person living in the United States is approximately $ 53 , 000 (or over $ 140 , 000 per U.S. household). The following data represent the U.S. debt for the years 2001—2014. Since the debt D depends on the year y , and each input corresponds to exactly one output, the debt is a function of the year. So D(y) represents the debt for each year y . (a) Plot the points ( 2001 , 5807 ) , ( 2002 , 6228 ) , and so on in a Cartesian plane. (b) Draw a line segment from the point ( 2001 , 5807 ) to ( 2006 , 8507 ) . What does the slope of this line segment represent? (c) Find the average rate of change of the debt from 2002 to 2004. (d) Find the average rate of change of the debt from 2006 to 2008. (e) Find the average rate of change of the debt from 2010 to 2012. (f) What appears to be happening to the average rate of change as time passes?
82. National Debt The size of the total debt owed by the United States federal government continues to grow. In fact, according to the Department of the Treasury, the debt per person living in the United States is approximately $ 53 , 000 (or over $ 140 , 000 per U.S. household). The following data represent the U.S. debt for the years 2001—2014. Since the debt D depends on the year y , and each input corresponds to exactly one output, the debt is a function of the year. So D(y) represents the debt for each year y . (a) Plot the points ( 2001 , 5807 ) , ( 2002 , 6228 ) , and so on in a Cartesian plane. (b) Draw a line segment from the point ( 2001 , 5807 ) to ( 2006 , 8507 ) . What does the slope of this line segment represent? (c) Find the average rate of change of the debt from 2002 to 2004. (d) Find the average rate of change of the debt from 2006 to 2008. (e) Find the average rate of change of the debt from 2010 to 2012. (f) What appears to be happening to the average rate of change as time passes?
Solution Summary: The author explains how to find the following values using the given data: a. Plotting given points in the Cartesian plane.
82. National Debt The size of the total debt owed by the United States federal government continues to grow. In fact, according to the Department of the Treasury, the debt per person living in the United States is approximately
(or over
per U.S. household). The following data represent the U.S. debt for the years 2001—2014. Since the debt D depends on the year y, and each input corresponds to exactly one output, the debt is a function of the year. So D(y) represents the debt for each year y.
(a) Plot the points
,
, and so on in a Cartesian plane.
(b) Draw a line segment from the point
to
. What does the slope of this line segment represent?
(c) Find the average rate of change of the debt from 2002 to 2004.
(d) Find the average rate of change of the debt from 2006 to 2008.
(e) Find the average rate of change of the debt from 2010 to 2012.
(f) What appears to be happening to the average rate of change as time passes?
Need a deep-dive on the concept behind this application? Look no further. Learn more about this topic, calculus and related others by exploring similar questions and additional content below.
Solve ANY Optimization Problem in 5 Steps w/ Examples. What are they and How do you solve them?; Author: Ace Tutors;https://www.youtube.com/watch?v=BfOSKc_sncg;License: Standard YouTube License, CC-BY
Types of solution in LPP|Basic|Multiple solution|Unbounded|Infeasible|GTU|Special case of LP problem; Author: Mechanical Engineering Management;https://www.youtube.com/watch?v=F-D2WICq8Sk;License: Standard YouTube License, CC-BY


 Calculus: Early TranscendentalsCalculusISBN:9781285741550Author:James StewartPublisher:Cengage Learning
 Thomas' Calculus (14th Edition)CalculusISBN:9780134438986Author:Joel R. Hass, Christopher E. Heil, Maurice D. WeirPublisher:PEARSON
 Calculus: Early Transcendentals (3rd Edition)CalculusISBN:9780134763644Author:William L. Briggs, Lyle Cochran, Bernard Gillett, Eric SchulzPublisher:PEARSON
 Calculus: Early TranscendentalsCalculusISBN:9781319050740Author:Jon Rogawski, Colin Adams, Robert FranzosaPublisher:W. H. Freeman
 Calculus: Early Transcendental FunctionsCalculusISBN:9781337552516Author:Ron Larson, Bruce H. EdwardsPublisher:Cengage Learning