
Essentials of Statistics, Books a la Carte Edition (5th Edition)
5th Edition
ISBN: 9780321926739
Author: Mario F. Triola
Publisher: PEARSON
expand_more
expand_more
format_list_bulleted
Concept explainers
Videos
Textbook Question
Chapter 2.3, Problem 5BSC
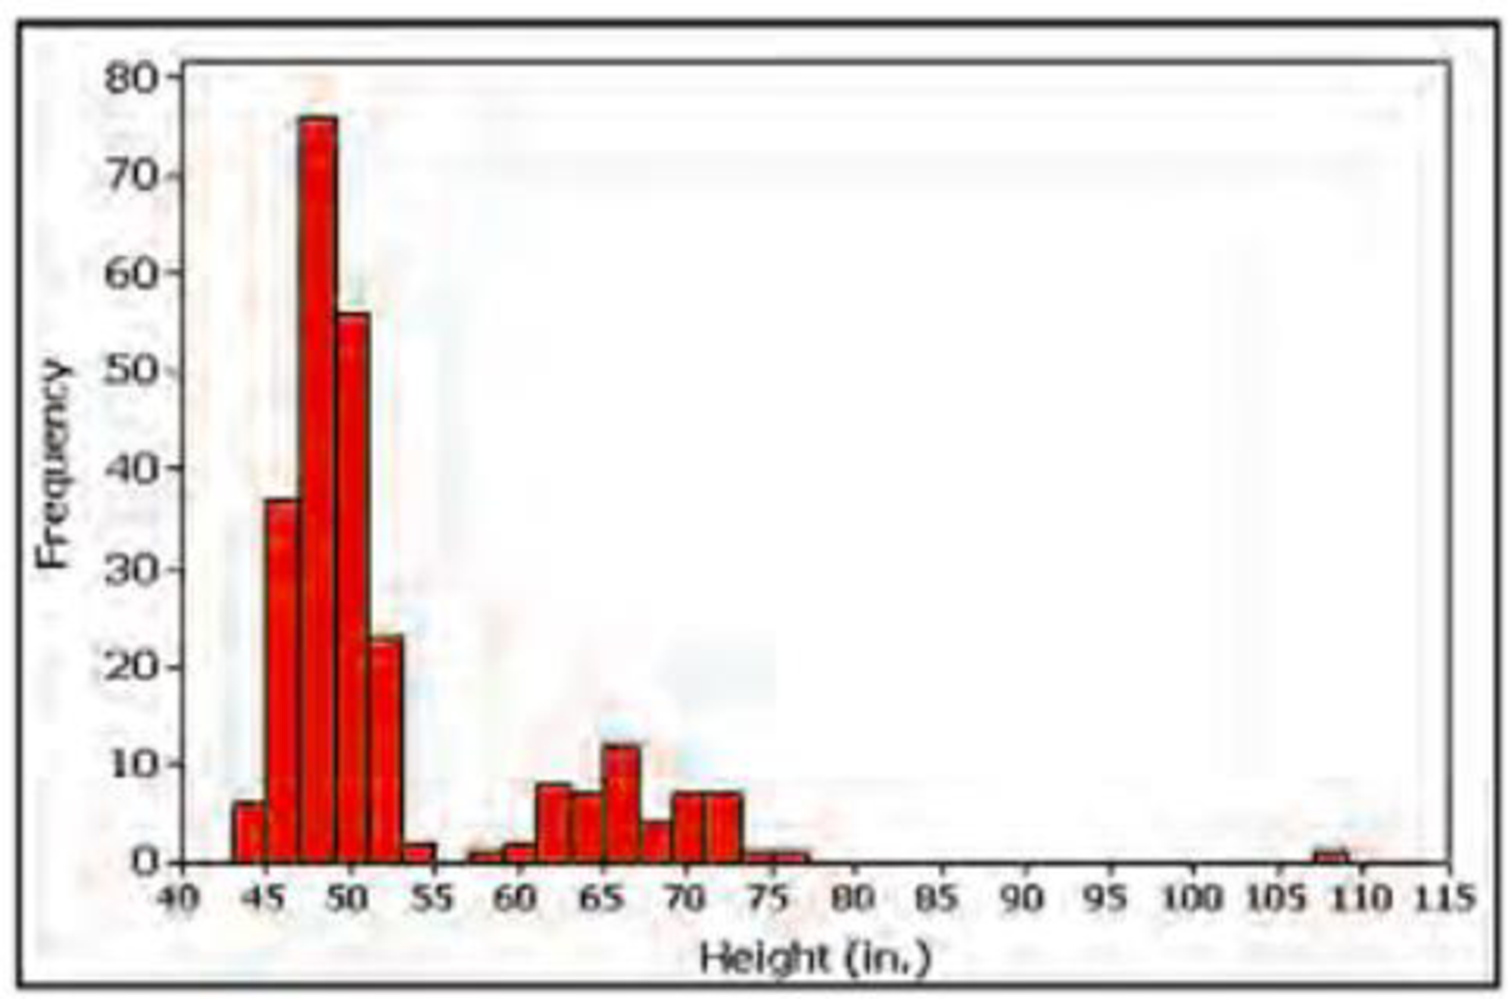
Interpreting a Histogram. In Exercises 5-8, answer the questions by referring to the following Minitab-generated histogram, which represents the heights (inches) of people randomly selected from those who entered New York City’s Museum of Natural History during a recent Friday morning.
MINITAB
5.
Expert Solution & Answer
Want to see the full answer?
Check out a sample textbook solution
Students have asked these similar questions
08:34
◄ Classroom
07:59
Probs. 5-32/33
D
ا.
89
5-34. Determine the horizontal and vertical components
of reaction at the pin A and the normal force at the smooth
peg B on the member.
A
0,4 m
0.4 m
Prob. 5-34
F=600 N
fr
th
ar
0.
163586
5-37. The wooden plank resting between the buildings
deflects slightly when it supports the 50-kg boy. This
deflection causes a triangular distribution of load at its ends.
having maximum intensities of w, and wg. Determine w
and wg. each measured in N/m. when the boy is standing
3 m from one end as shown. Neglect the mass of the plank.
0.45 m
3 m
Examine the Variables: Carefully review and note the names of all variables in the dataset. Examples of these variables include:
Mileage (mpg)
Number of Cylinders (cyl)
Displacement (disp)
Horsepower (hp)
Research: Google to understand these variables.
Statistical Analysis: Select mpg variable, and perform the following statistical tests. Once you are done with these tests using mpg variable, repeat the same with hp
Mean
Median
First Quartile (Q1)
Second Quartile (Q2)
Third Quartile (Q3)
Fourth Quartile (Q4)
10th Percentile
70th Percentile
Skewness
Kurtosis
Document Your Results:
In RStudio: Before running each statistical test, provide a heading in the format shown at the bottom. “# Mean of mileage – Your name’s command”
In Microsoft Word: Once you've completed all tests, take a screenshot of your results in RStudio and paste it into a Microsoft Word document. Make sure that snapshots are very clear. You will need multiple snapshots. Also transfer these results to the…
Chapter 2 Solutions
Essentials of Statistics, Books a la Carte Edition (5th Edition)
Ch. 2.2 - Frequency Distribution Table 2-2 on page 45 is a...Ch. 2.2 - Relative Frequency Distribution After construction...Ch. 2.2 - Do You Believe? In a Harris Interactive survey,...Ch. 2.2 - Analyzing a Frequency Distribution The...Ch. 2.2 - In Exercises 5-10, identify the class width, class...Ch. 2.2 - In Exercises 5-10, identify the class width, class...Ch. 2.2 - In Exercises 5-10, identify the class width, class...Ch. 2.2 - In Exercises 5-10, identify the class width, class...Ch. 2.2 - In Exercises 5-10, identify the class width, class...Ch. 2.2 - In Exercises 5-10, identify the class width, class...
Ch. 2.2 - Normal Distributions. In Exercises 11-14, answer...Ch. 2.2 - Normal Distributions. In Exercises 11-14, answer...Ch. 2.2 - Normal Distributions. In Exercises 11-14, answer...Ch. 2.2 - Normal Distributions. In Exercises 11-14, answer...Ch. 2.2 - Relative Frequencies for Comparisons. In Exercises...Ch. 2.2 - Relative Frequencies for Comparisons. In Exercises...Ch. 2.2 - Cumulative Frequency Distributions. In Exercises...Ch. 2.2 - Cumulative Frequency Distributions. In Exercises...Ch. 2.2 - Analysis of Last Digits Heights of statistics...Ch. 2.2 - Analysis of Last Digits Weights of respondents...Ch. 2.2 - Constructing Frequency Distributions. In Exercises...Ch. 2.2 - Constructing Frequency Distributions. In Exercises...Ch. 2.2 - Constructing Frequency Distributions. In Exercises...Ch. 2.2 - Constructing Frequency Distributions. In Exercises...Ch. 2.2 - Constructing Frequency Distributions. In Exercises...Ch. 2.2 - Constructing Frequency Distributions. In Exercises...Ch. 2.2 - Constructing Frequency Distributions. In Exercises...Ch. 2.2 - Constructing Frequency Distributions. In Exercises...Ch. 2.2 - Categorical Data. In Exercises 29-32, use the...Ch. 2.2 - Categorical Data. In Exercises 29-32, use the...Ch. 2.2 - Categorical Data. In Exercises 29-32, use the...Ch. 2.2 - Categorical Data. In Exercises 29-32, use the...Ch. 2.2 - Interpreting Effects of Outliers Refer to Data Set...Ch. 2.2 - Number of Classes According to what is known as...Ch. 2.3 - Prob. 1BSCCh. 2.3 - Voluntary Response Sample The histogram in Figure...Ch. 2.3 - Small Data NASA provides these duration times (in...Ch. 2.3 - Normal Distribution When it refers to a normal...Ch. 2.3 - Interpreting a Histogram. In Exercises 5-8, answer...Ch. 2.3 - Interpreting a Histogram. In Exercises 5-8, answer...Ch. 2.3 - Interpreting a Histogram. In Exercises 5-8, answer...Ch. 2.3 - Interpreting a Histogram. In Exercises 5-8, answer...Ch. 2.3 - Analysis of Last Digits Use the frequency...Ch. 2.3 - Analysis of Last Digits Use the frequency...Ch. 2.3 - Constructing Histograms. In Exercises 9-18,...Ch. 2.3 - Constructing Histograms. In Exercises 9-18,...Ch. 2.3 - Constructing Histograms. In Exercises 9-18,...Ch. 2.3 - Constructing Histograms. In Exercises 9-18,...Ch. 2.3 - Prob. 15BSCCh. 2.3 - Constructing Histograms. In Exercises 9-18,...Ch. 2.3 - Constructing Histograms. In Exercises 9-18,...Ch. 2.3 - Constructing Histograms. In Exercises 9-18,...Ch. 2.3 - Back-to-Back Relative Frequency Histograms When...Ch. 2.3 - Interpreting a Histogram. In Exercises 5-8, answer...Ch. 2.4 - Bar Chart and Pareto Chart A bar chart and a...Ch. 2.4 - Scatterplot What is a scatterplot? What type of...Ch. 2.4 - SAT Scores Listed below are SAT scores from a...Ch. 2.4 - SAT Scores Given that the data in Exercise 3 were...Ch. 2.4 - Scatterplots. In Exercises 5-8, use the given...Ch. 2.4 - Scatterplots. In Exercises 5-8, use the given...Ch. 2.4 - Scatterplots. In Exercises 5-8, use the given...Ch. 2.4 - Scatterplots. In Exercises 5-8, use the given...Ch. 2.4 - Time-Series Graphs. In Exercises 9 and 10,...Ch. 2.4 - Time-Series Graphs. In Exercises 9 and 10,...Ch. 2.4 - Dotplots. In Exercises II and 12, construct the...Ch. 2.4 - Dotplots. In Exercises 11 and 12, construct the...Ch. 2.4 - Stemplots. In Exercises 13 and 14, construct the...Ch. 2.4 - Stemplots. In Exercises 13 and 14, construct the...Ch. 2.4 - Pareto Charts. In Exercises 15 and 16, construct...Ch. 2.4 - Pareto Charts. In Exercises 15 and 16, construct...Ch. 2.4 - Pie Charts. In Exercises 17 and 18, construct the...Ch. 2.4 - Pie Charts. In Exercises 17 and 18, construct the...Ch. 2.4 - Frequency Polygon. In Exercises 19 and 20,...Ch. 2.4 - Frequency Polygon. In Exercises 19 and 20,...Ch. 2.4 - Deceptive Graphs. In Exercises 21-24, identify the...Ch. 2.4 - Deceptive Graphs. In Exercises 21-24, identify the...Ch. 2.4 - Deceptive Graphs. In Exercises 21-24, identify the...Ch. 2.4 - Deceptive Graphs. In Exercises 21-24, identify the...Ch. 2.4 - Back-to-Back Stemplots Exercise 19 in Section 2-3...Ch. 2 - When one is constructing a table representing the...Ch. 2 - When one is constructing a table representing the...Ch. 2 - When one is constructing a table representing the...Ch. 2 - A stemplot is created from the intervals (min)...Ch. 2 - In the California Daily 4 lottery, four digits...Ch. 2 - In an investigation of the travel costs of college...Ch. 2 - In an investigation of the relationship between...Ch. 2 - As a quality control manager at Sony, you find...Ch. 2 - What characteristic of a data set can be better...Ch. 2 - A histogram is to be constructed from the brain...Ch. 2 - Frequency Distribution of Brain Volumes Construct...Ch. 2 - Histogram of Brain Volumes Construct the histogram...Ch. 2 - Dotplot of California Lottery In the California...Ch. 2 - Stemplot of IQ Scores Listed below are the first...Ch. 2 - CO Emissions Listed below are the amounts (million...Ch. 2 - CO and NO Emissions Exercise 5 lists the amounts...Ch. 2 - Sports Equipment According to USA Today, the...Ch. 2 - In Exercises 1-5, refer to the table in the...Ch. 2 - In Exercises 1-5, refer to the table in the...Ch. 2 - In Exercises 1-5, refer to the table in the...Ch. 2 - In Exercises 1-5, refer to the table in the...Ch. 2 - In Exercises 1-5, refer to the table in the...Ch. 2 - Grooming Time Listed below are times (minutes)...Ch. 2 - Histogram of Grooming Times Use the frequency...Ch. 2 - Stemplot of Grooming Times Use the data from...Ch. 2 - Technology Project It was noted in this section...Ch. 2 - Flight Planning Data Set 15 in Appendix B includes...Ch. 2 - Prob. 2FDDCh. 2 - Flight Planning Data Set 15 in Appendix B includes...
Knowledge Booster


Learn more about
Need a deep-dive on the concept behind this application? Look no further. Learn more about this topic, statistics and related others by exploring similar questions and additional content below.Similar questions
- Examine the Variables: Carefully review and note the names of all variables in the dataset. Examples of these variables include: Mileage (mpg) Number of Cylinders (cyl) Displacement (disp) Horsepower (hp) Research: Google to understand these variables. Statistical Analysis: Select mpg variable, and perform the following statistical tests. Once you are done with these tests using mpg variable, repeat the same with hp Mean Median First Quartile (Q1) Second Quartile (Q2) Third Quartile (Q3) Fourth Quartile (Q4) 10th Percentile 70th Percentile Skewness Kurtosis Document Your Results: In RStudio: Before running each statistical test, provide a heading in the format shown at the bottom. “# Mean of mileage – Your name’s command” In Microsoft Word: Once you've completed all tests, take a screenshot of your results in RStudio and paste it into a Microsoft Word document. Make sure that snapshots are very clear. You will need multiple snapshots. Also transfer these results to the…arrow_forward2 (VaR and ES) Suppose X1 are independent. Prove that ~ Unif[-0.5, 0.5] and X2 VaRa (X1X2) < VaRa(X1) + VaRa (X2). ~ Unif[-0.5, 0.5]arrow_forward8 (Correlation and Diversification) Assume we have two stocks, A and B, show that a particular combination of the two stocks produce a risk-free portfolio when the correlation between the return of A and B is -1.arrow_forward
- 9 (Portfolio allocation) Suppose R₁ and R2 are returns of 2 assets and with expected return and variance respectively r₁ and 72 and variance-covariance σ2, 0%½ and σ12. Find −∞ ≤ w ≤ ∞ such that the portfolio wR₁ + (1 - w) R₂ has the smallest risk.arrow_forward7 (Multivariate random variable) Suppose X, €1, €2, €3 are IID N(0, 1) and Y2 Y₁ = 0.2 0.8X + €1, Y₂ = 0.3 +0.7X+ €2, Y3 = 0.2 + 0.9X + €3. = (In models like this, X is called the common factors of Y₁, Y₂, Y3.) Y = (Y1, Y2, Y3). (a) Find E(Y) and cov(Y). (b) What can you observe from cov(Y). Writearrow_forward1 (VaR and ES) Suppose X ~ f(x) with 1+x, if 0> x > −1 f(x) = 1−x if 1 x > 0 Find VaRo.05 (X) and ES0.05 (X).arrow_forward
- Joy is making Christmas gifts. She has 6 1/12 feet of yarn and will need 4 1/4 to complete our project. How much yarn will she have left over compute this solution in two different ways arrow_forwardSolve for X. Explain each step. 2^2x • 2^-4=8arrow_forwardOne hundred people were surveyed, and one question pertained to their educational background. The results of this question and their genders are given in the following table. Female (F) Male (F′) Total College degree (D) 30 20 50 No college degree (D′) 30 20 50 Total 60 40 100 If a person is selected at random from those surveyed, find the probability of each of the following events.1. The person is female or has a college degree. Answer: equation editor Equation Editor 2. The person is male or does not have a college degree. Answer: equation editor Equation Editor 3. The person is female or does not have a college degree.arrow_forward
arrow_back_ios
SEE MORE QUESTIONS
arrow_forward_ios
Recommended textbooks for you
 Holt Mcdougal Larson Pre-algebra: Student Edition...AlgebraISBN:9780547587776Author:HOLT MCDOUGALPublisher:HOLT MCDOUGAL
 College Algebra (MindTap Course List)AlgebraISBN:9781305652231Author:R. David Gustafson, Jeff HughesPublisher:Cengage Learning
 Big Ideas Math A Bridge To Success Algebra 1: Stu...AlgebraISBN:9781680331141Author:HOUGHTON MIFFLIN HARCOURTPublisher:Houghton Mifflin Harcourt
 Glencoe Algebra 1, Student Edition, 9780079039897...AlgebraISBN:9780079039897Author:CarterPublisher:McGraw Hill
Holt Mcdougal Larson Pre-algebra: Student Edition...
Algebra
ISBN:9780547587776
Author:HOLT MCDOUGAL
Publisher:HOLT MCDOUGAL
College Algebra (MindTap Course List)
Algebra
ISBN:9781305652231
Author:R. David Gustafson, Jeff Hughes
Publisher:Cengage Learning
Big Ideas Math A Bridge To Success Algebra 1: Stu...
Algebra
ISBN:9781680331141
Author:HOUGHTON MIFFLIN HARCOURT
Publisher:Houghton Mifflin Harcourt
Glencoe Algebra 1, Student Edition, 9780079039897...
Algebra
ISBN:9780079039897
Author:Carter
Publisher:McGraw Hill
Statistics 4.1 Point Estimators; Author: Dr. Jack L. Jackson II;https://www.youtube.com/watch?v=2MrI0J8XCEE;License: Standard YouTube License, CC-BY
Statistics 101: Point Estimators; Author: Brandon Foltz;https://www.youtube.com/watch?v=4v41z3HwLaM;License: Standard YouTube License, CC-BY
Central limit theorem; Author: 365 Data Science;https://www.youtube.com/watch?v=b5xQmk9veZ4;License: Standard YouTube License, CC-BY
Point Estimate Definition & Example; Author: Prof. Essa;https://www.youtube.com/watch?v=OTVwtvQmSn0;License: Standard Youtube License
Point Estimation; Author: Vamsidhar Ambatipudi;https://www.youtube.com/watch?v=flqhlM2bZWc;License: Standard Youtube License