
Essentials of Statistics, Books a la Carte Edition (5th Edition)
5th Edition
ISBN: 9780321926739
Author: Mario F. Triola
Publisher: PEARSON
expand_more
expand_more
format_list_bulleted
Concept explainers
Videos
Textbook Question
Chapter 2, Problem 3RE
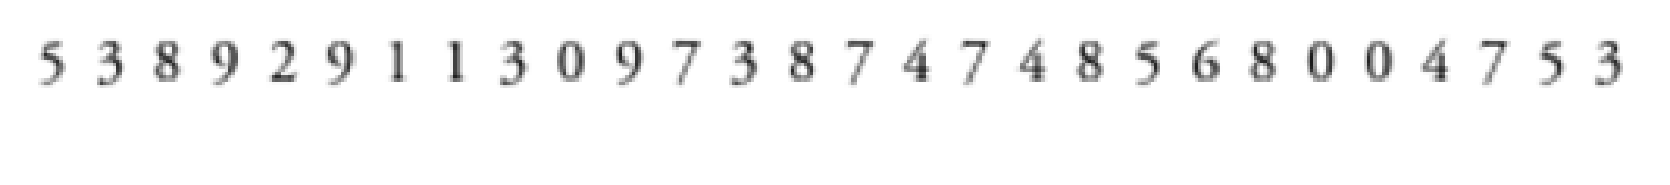
Dotplot of California Lottery In the California Daily 4 lottery, four digits are randomly selected each day. Listed below are the digits that were selected in one recent week. Construct a dotplot. Does the dotplot suggest that the lottery is fair?
Expert Solution & Answer
Want to see the full answer?
Check out a sample textbook solution
Students have asked these similar questions
You assume that the annual incomes for certain workers are normal with a mean of $28,500 and a standard deviation of $2,400.
What’s the chance that a randomly selected employee makes more than $30,000?What’s the chance that 36 randomly selected employees make more than $30,000, on average?
What’s the chance that a fair coin comes up heads more than 60 times when you toss it 100 times?
Suppose that you have a normal population of quiz scores with mean 40 and standard deviation 10.
Select a random sample of 40. What’s the chance that the mean of the quiz scores won’t exceed 45?Select one individual from the population. What’s the chance that his/her quiz score won’t exceed 45?
Chapter 2 Solutions
Essentials of Statistics, Books a la Carte Edition (5th Edition)
Ch. 2.2 - Frequency Distribution Table 2-2 on page 45 is a...Ch. 2.2 - Relative Frequency Distribution After construction...Ch. 2.2 - Do You Believe? In a Harris Interactive survey,...Ch. 2.2 - Analyzing a Frequency Distribution The...Ch. 2.2 - In Exercises 5-10, identify the class width, class...Ch. 2.2 - In Exercises 5-10, identify the class width, class...Ch. 2.2 - In Exercises 5-10, identify the class width, class...Ch. 2.2 - In Exercises 5-10, identify the class width, class...Ch. 2.2 - In Exercises 5-10, identify the class width, class...Ch. 2.2 - In Exercises 5-10, identify the class width, class...
Ch. 2.2 - Normal Distributions. In Exercises 11-14, answer...Ch. 2.2 - Normal Distributions. In Exercises 11-14, answer...Ch. 2.2 - Normal Distributions. In Exercises 11-14, answer...Ch. 2.2 - Normal Distributions. In Exercises 11-14, answer...Ch. 2.2 - Relative Frequencies for Comparisons. In Exercises...Ch. 2.2 - Relative Frequencies for Comparisons. In Exercises...Ch. 2.2 - Cumulative Frequency Distributions. In Exercises...Ch. 2.2 - Cumulative Frequency Distributions. In Exercises...Ch. 2.2 - Analysis of Last Digits Heights of statistics...Ch. 2.2 - Analysis of Last Digits Weights of respondents...Ch. 2.2 - Constructing Frequency Distributions. In Exercises...Ch. 2.2 - Constructing Frequency Distributions. In Exercises...Ch. 2.2 - Constructing Frequency Distributions. In Exercises...Ch. 2.2 - Constructing Frequency Distributions. In Exercises...Ch. 2.2 - Constructing Frequency Distributions. In Exercises...Ch. 2.2 - Constructing Frequency Distributions. In Exercises...Ch. 2.2 - Constructing Frequency Distributions. In Exercises...Ch. 2.2 - Constructing Frequency Distributions. In Exercises...Ch. 2.2 - Categorical Data. In Exercises 29-32, use the...Ch. 2.2 - Categorical Data. In Exercises 29-32, use the...Ch. 2.2 - Categorical Data. In Exercises 29-32, use the...Ch. 2.2 - Categorical Data. In Exercises 29-32, use the...Ch. 2.2 - Interpreting Effects of Outliers Refer to Data Set...Ch. 2.2 - Number of Classes According to what is known as...Ch. 2.3 - Prob. 1BSCCh. 2.3 - Voluntary Response Sample The histogram in Figure...Ch. 2.3 - Small Data NASA provides these duration times (in...Ch. 2.3 - Normal Distribution When it refers to a normal...Ch. 2.3 - Interpreting a Histogram. In Exercises 5-8, answer...Ch. 2.3 - Interpreting a Histogram. In Exercises 5-8, answer...Ch. 2.3 - Interpreting a Histogram. In Exercises 5-8, answer...Ch. 2.3 - Interpreting a Histogram. In Exercises 5-8, answer...Ch. 2.3 - Analysis of Last Digits Use the frequency...Ch. 2.3 - Analysis of Last Digits Use the frequency...Ch. 2.3 - Constructing Histograms. In Exercises 9-18,...Ch. 2.3 - Constructing Histograms. In Exercises 9-18,...Ch. 2.3 - Constructing Histograms. In Exercises 9-18,...Ch. 2.3 - Constructing Histograms. In Exercises 9-18,...Ch. 2.3 - Prob. 15BSCCh. 2.3 - Constructing Histograms. In Exercises 9-18,...Ch. 2.3 - Constructing Histograms. In Exercises 9-18,...Ch. 2.3 - Constructing Histograms. In Exercises 9-18,...Ch. 2.3 - Back-to-Back Relative Frequency Histograms When...Ch. 2.3 - Interpreting a Histogram. In Exercises 5-8, answer...Ch. 2.4 - Bar Chart and Pareto Chart A bar chart and a...Ch. 2.4 - Scatterplot What is a scatterplot? What type of...Ch. 2.4 - SAT Scores Listed below are SAT scores from a...Ch. 2.4 - SAT Scores Given that the data in Exercise 3 were...Ch. 2.4 - Scatterplots. In Exercises 5-8, use the given...Ch. 2.4 - Scatterplots. In Exercises 5-8, use the given...Ch. 2.4 - Scatterplots. In Exercises 5-8, use the given...Ch. 2.4 - Scatterplots. In Exercises 5-8, use the given...Ch. 2.4 - Time-Series Graphs. In Exercises 9 and 10,...Ch. 2.4 - Time-Series Graphs. In Exercises 9 and 10,...Ch. 2.4 - Dotplots. In Exercises II and 12, construct the...Ch. 2.4 - Dotplots. In Exercises 11 and 12, construct the...Ch. 2.4 - Stemplots. In Exercises 13 and 14, construct the...Ch. 2.4 - Stemplots. In Exercises 13 and 14, construct the...Ch. 2.4 - Pareto Charts. In Exercises 15 and 16, construct...Ch. 2.4 - Pareto Charts. In Exercises 15 and 16, construct...Ch. 2.4 - Pie Charts. In Exercises 17 and 18, construct the...Ch. 2.4 - Pie Charts. In Exercises 17 and 18, construct the...Ch. 2.4 - Frequency Polygon. In Exercises 19 and 20,...Ch. 2.4 - Frequency Polygon. In Exercises 19 and 20,...Ch. 2.4 - Deceptive Graphs. In Exercises 21-24, identify the...Ch. 2.4 - Deceptive Graphs. In Exercises 21-24, identify the...Ch. 2.4 - Deceptive Graphs. In Exercises 21-24, identify the...Ch. 2.4 - Deceptive Graphs. In Exercises 21-24, identify the...Ch. 2.4 - Back-to-Back Stemplots Exercise 19 in Section 2-3...Ch. 2 - When one is constructing a table representing the...Ch. 2 - When one is constructing a table representing the...Ch. 2 - When one is constructing a table representing the...Ch. 2 - A stemplot is created from the intervals (min)...Ch. 2 - In the California Daily 4 lottery, four digits...Ch. 2 - In an investigation of the travel costs of college...Ch. 2 - In an investigation of the relationship between...Ch. 2 - As a quality control manager at Sony, you find...Ch. 2 - What characteristic of a data set can be better...Ch. 2 - A histogram is to be constructed from the brain...Ch. 2 - Frequency Distribution of Brain Volumes Construct...Ch. 2 - Histogram of Brain Volumes Construct the histogram...Ch. 2 - Dotplot of California Lottery In the California...Ch. 2 - Stemplot of IQ Scores Listed below are the first...Ch. 2 - CO Emissions Listed below are the amounts (million...Ch. 2 - CO and NO Emissions Exercise 5 lists the amounts...Ch. 2 - Sports Equipment According to USA Today, the...Ch. 2 - In Exercises 1-5, refer to the table in the...Ch. 2 - In Exercises 1-5, refer to the table in the...Ch. 2 - In Exercises 1-5, refer to the table in the...Ch. 2 - In Exercises 1-5, refer to the table in the...Ch. 2 - In Exercises 1-5, refer to the table in the...Ch. 2 - Grooming Time Listed below are times (minutes)...Ch. 2 - Histogram of Grooming Times Use the frequency...Ch. 2 - Stemplot of Grooming Times Use the data from...Ch. 2 - Technology Project It was noted in this section...Ch. 2 - Flight Planning Data Set 15 in Appendix B includes...Ch. 2 - Prob. 2FDDCh. 2 - Flight Planning Data Set 15 in Appendix B includes...
Knowledge Booster


Learn more about
Need a deep-dive on the concept behind this application? Look no further. Learn more about this topic, statistics and related others by exploring similar questions and additional content below.Similar questions
- Suppose that you take a sample of 100 from a population that contains 45 percent Democrats. What sample size condition do you need to check here (if any)?What’s the standard error of ^P?Compare the standard errors of ^p n=100 for ,n=1000 , n=10,000, and comment.arrow_forwardSuppose that a class’s test scores have a mean of 80 and standard deviation of 5. You choose 25 students from the class. What’s the chance that the group’s average test score is more than 82?arrow_forwardSuppose that you collect data on 10 products and check their weights. The average should be 10 ounces, but your sample mean is 9 ounces with standard deviation 2 ounces. Find the standard score.What percentile is the standard score found in part a of this question closest to?Suppose that the mean really is 10 ounces. Do you find these results unusual? Use probabilities to explain.arrow_forward
- Suppose that you want to sample expensive computer chips, but you can have only n=3 of them. Should you continue the experiment?arrow_forwardSuppose that studies claim that 40 percent of cellphone owners use their phones in the car while driving. What’s the chance that more than 425 out of a random sample of 1,000 cellphone owners say they use their phones while driving?arrow_forwardSuppose that the average length of stay in Europe for American tourists is 17 days, with standard deviation 4.5. You choose a random sample of 16 American tourists. The sample of 16 stay an average of 18.5 days or more. What’s the chance of that happening?arrow_forward
- How do you recognize that a statistical problem requires you to use the CLT? Think of one or two clues you can look for. (Assume quantitative data.)arrow_forwardSuppose that you take a sample of 100 from a skewed population with mean 50 and standard deviation 15. What sample size condition do you need to check here (if any)?What’s the shape and center of the sampling distribution for ?What’s the standard error?arrow_forwardQuestion 3 The following stem-and-leaf displays the weekly salary of employees at this firm. Stem-and-Leaf Display Leaf Unit = 10.0 N=x 5 3 00123 12 4 0125888 (y) 5 11234456777 z 6 13568 5 7 154 2 8 46 i. Determine the value of x, y and z. [3] ii. What is the value of the median? [2] iii. Find the mode of this data set. iv. Calculate the range [1] [2]arrow_forward
- Let Y be a continuous RV with PDF otherwise Find the CDF, Fry), of Y . Find an expression for pth, p € (0, 1), quantile of the distribution. Find E(Y) and V(Y). Find E(-2Y + 1) and V(-3Y - 2). Find E(Y3).arrow_forwardLet X be a continuous RV with CDF Find P(X < 0), P(-1 < X < 1) and P(0.5 < X). Based on your answers to the above questions, what is the median of the distribu-tion? Why Find the PDF, fx (x), of X.arrow_forwardA survey of 581 citizens found that 313 of them favor a new bill introduced by the city. We want to find a 95% confidence interval for the true proportion of the population who favor the bill. What is the lower limit of the interval? Enter the result as a decimal rounded to 3 decimal digits. Your Answer:arrow_forward
arrow_back_ios
SEE MORE QUESTIONS
arrow_forward_ios
Recommended textbooks for you
 Holt Mcdougal Larson Pre-algebra: Student Edition...AlgebraISBN:9780547587776Author:HOLT MCDOUGALPublisher:HOLT MCDOUGAL
 College Algebra (MindTap Course List)AlgebraISBN:9781305652231Author:R. David Gustafson, Jeff HughesPublisher:Cengage Learning
 Algebra & Trigonometry with Analytic GeometryAlgebraISBN:9781133382119Author:SwokowskiPublisher:Cengage
 Glencoe Algebra 1, Student Edition, 9780079039897...AlgebraISBN:9780079039897Author:CarterPublisher:McGraw Hill
 College AlgebraAlgebraISBN:9781305115545Author:James Stewart, Lothar Redlin, Saleem WatsonPublisher:Cengage Learning
Holt Mcdougal Larson Pre-algebra: Student Edition...
Algebra
ISBN:9780547587776
Author:HOLT MCDOUGAL
Publisher:HOLT MCDOUGAL
College Algebra (MindTap Course List)
Algebra
ISBN:9781305652231
Author:R. David Gustafson, Jeff Hughes
Publisher:Cengage Learning
Algebra & Trigonometry with Analytic Geometry
Algebra
ISBN:9781133382119
Author:Swokowski
Publisher:Cengage
Glencoe Algebra 1, Student Edition, 9780079039897...
Algebra
ISBN:9780079039897
Author:Carter
Publisher:McGraw Hill
College Algebra
Algebra
ISBN:9781305115545
Author:James Stewart, Lothar Redlin, Saleem Watson
Publisher:Cengage Learning
Find number of persons in a part with 66 handshakes Combinations; Author: Anil Kumar;https://www.youtube.com/watch?v=33TgLi-wp3E;License: Standard YouTube License, CC-BY
Discrete Math 6.3.1 Permutations and Combinations; Author: Kimberly Brehm;https://www.youtube.com/watch?v=J1m9sB5XZQc;License: Standard YouTube License, CC-BY
How to use permutations and combinations; Author: Mario's Math Tutoring;https://www.youtube.com/watch?v=NEGxh_D7yKU;License: Standard YouTube License, CC-BY
Permutations and Combinations | Counting | Don't Memorise; Author: Don't Memorise;https://www.youtube.com/watch?v=0NAASclUm4k;License: Standard Youtube License
Permutations and Combinations Tutorial; Author: The Organic Chemistry Tutor;https://www.youtube.com/watch?v=XJnIdRXUi7A;License: Standard YouTube License, CC-BY