
Intro STATS, Books a la Carte Plus New Mystatlab with Pearson Etext -- Access Card Package
4th Edition
ISBN: 9780321869852
Author: Richard D. De Veaux
Publisher: PEARSON
expand_more
expand_more
format_list_bulleted
Videos
Textbook Question
Chapter 23, Problem 59E
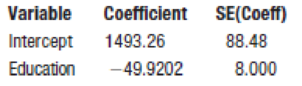
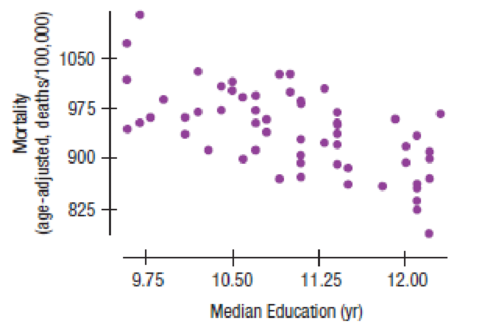
Education and mortality The following software output is based on the mortality rate (deaths per 100,000 people) and the education level (average number of years in school) for 58 U.S. cities.
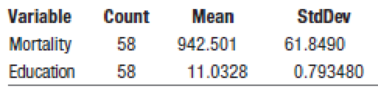
Dependent variable is Mortality
R-squared = 41.0%
s = 47.92 with 58 – 2 = 56 degrees of freedom
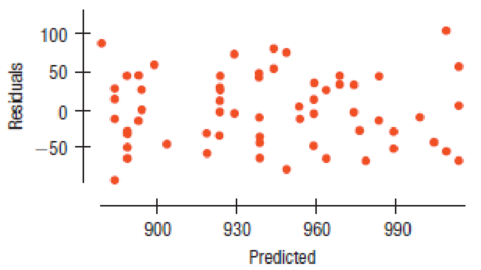
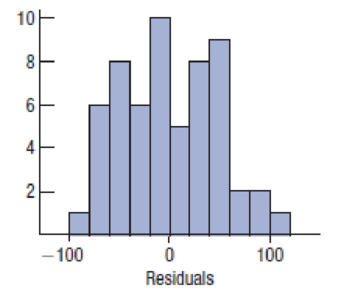
- a) Comment on the assumptions for inference.
- b) Is there evidence of a strong association between the level of Education in a city and the Mortality rate? Test an appropriate hypothesis and state your conclusion.
- c) Can we conclude that getting more education is likely (on average) to prolong your life? Why or why not?
- d) Find a 95% confidence interval for the slope of the true relationship.
- e) Explain what your interval means.
- f) Find a 95% confidence interval for the average Mortality rate in cities where the adult population completed an average of 12 years of school.
Expert Solution & Answer
Want to see the full answer?
Check out a sample textbook solution
Students have asked these similar questions
Show all work
Show all work
Show all work
Chapter 23 Solutions
Intro STATS, Books a la Carte Plus New Mystatlab with Pearson Etext -- Access Card Package
Ch. 23.4 - Researchers in Food Science studied how big...Ch. 23.4 - Prob. 2JCCh. 23.4 - Prob. 3JCCh. 23 - Prob. 1ECh. 23 - Prob. 2ECh. 23 - Prob. 3ECh. 23 - Prob. 4ECh. 23 - Prob. 5ECh. 23 - Prob. 6ECh. 23 - Prob. 7E
Ch. 23 - Prob. 8ECh. 23 - Prob. 9ECh. 23 - Prob. 10ECh. 23 - Prob. 11ECh. 23 - 12. Shoot to score, double overtime One of the...Ch. 23 - Prob. 13ECh. 23 - Prob. 14ECh. 23 - Prob. 15ECh. 23 - Prob. 16ECh. 23 - Prob. 17ECh. 23 - Prob. 18ECh. 23 - Prob. 19ECh. 23 - Prob. 20ECh. 23 - Prob. 21ECh. 23 - Prob. 22ECh. 23 - Prob. 23ECh. 23 - Prob. 24ECh. 23 - Prob. 25ECh. 23 - Prob. 26ECh. 23 - Prob. 27ECh. 23 - Prob. 28ECh. 23 - Prob. 29ECh. 23 - Prob. 30ECh. 23 - Prob. 31ECh. 23 - Prob. 32ECh. 23 - Prob. 33ECh. 23 - Prob. 34ECh. 23 - Fuel economy A consumer organization has reported...Ch. 23 - 36. SAT scores How strong was the association...Ch. 23 - Prob. 37ECh. 23 - 38. SATs, part II Consider the high school SAT...Ch. 23 - 39. Fuel economy, part III Consider again the data...Ch. 23 - 40. SATs, again Consider the high school SAT...Ch. 23 - Cereals A healthy cereal should be low in both...Ch. 23 - Brain size Does your IQ depend on the size of your...Ch. 23 - Prob. 43ECh. 23 - Prob. 44ECh. 23 - Prob. 45ECh. 23 - Prob. 46ECh. 23 - Ozone and population The Environmental Protection...Ch. 23 - Prob. 48ECh. 23 - Prob. 49ECh. 23 - 50. More sales and profits Consider again the...Ch. 23 - Prob. 51ECh. 23 - Crawling Researchers at the University of Denver...Ch. 23 - 53. Body fat Do the data shown in the table below...Ch. 23 - Prob. 54ECh. 23 - Midterms The data set below shows midterm and...Ch. 23 - Prob. 56ECh. 23 - Prob. 57ECh. 23 - All the efficiency money can buy 2011 A sample of...Ch. 23 - Education and mortality The following software...Ch. 23 - Property assessments The following software output...Ch. 23 - Prob. 61ECh. 23 - Prob. 62E
Knowledge Booster


Learn more about
Need a deep-dive on the concept behind this application? Look no further. Learn more about this topic, statistics and related others by exploring similar questions and additional content below.Similar questions
- A marketing agency wants to determine whether different advertising platforms generate significantly different levels of customer engagement. The agency measures the average number of daily clicks on ads for three platforms: Social Media, Search Engines, and Email Campaigns. The agency collects data on daily clicks for each platform over a 10-day period and wants to test whether there is a statistically significant difference in the mean number of daily clicks among these platforms. Conduct ANOVA test. You can provide your answer by inserting a text box and the answer must include: also please provide a step by on getting the answers in excel Null hypothesis, Alternative hypothesis, Show answer (output table/summary table), and Conclusion based on the P value.arrow_forwardA company found that the daily sales revenue of its flagship product follows a normal distribution with a mean of $4500 and a standard deviation of $450. The company defines a "high-sales day" that is, any day with sales exceeding $4800. please provide a step by step on how to get the answers Q: What percentage of days can the company expect to have "high-sales days" or sales greater than $4800? Q: What is the sales revenue threshold for the bottom 10% of days? (please note that 10% refers to the probability/area under bell curve towards the lower tail of bell curve) Provide answers in the yellow cellsarrow_forwardBusiness Discussarrow_forward
- The following data represent total ventilation measured in liters of air per minute per square meter of body area for two independent (and randomly chosen) samples. Analyze these data using the appropriate non-parametric hypothesis testarrow_forwardeach column represents before & after measurements on the same individual. Analyze with the appropriate non-parametric hypothesis test for a paired design.arrow_forwardShould you be confident in applying your regression equation to estimate the heart rate of a python at 35°C? Why or why not?arrow_forward
arrow_back_ios
SEE MORE QUESTIONS
arrow_forward_ios
Recommended textbooks for you
 Big Ideas Math A Bridge To Success Algebra 1: Stu...AlgebraISBN:9781680331141Author:HOUGHTON MIFFLIN HARCOURTPublisher:Houghton Mifflin Harcourt
 Glencoe Algebra 1, Student Edition, 9780079039897...AlgebraISBN:9780079039897Author:CarterPublisher:McGraw Hill
 Holt Mcdougal Larson Pre-algebra: Student Edition...AlgebraISBN:9780547587776Author:HOLT MCDOUGALPublisher:HOLT MCDOUGAL
Big Ideas Math A Bridge To Success Algebra 1: Stu...
Algebra
ISBN:9781680331141
Author:HOUGHTON MIFFLIN HARCOURT
Publisher:Houghton Mifflin Harcourt
Glencoe Algebra 1, Student Edition, 9780079039897...
Algebra
ISBN:9780079039897
Author:Carter
Publisher:McGraw Hill
Holt Mcdougal Larson Pre-algebra: Student Edition...
Algebra
ISBN:9780547587776
Author:HOLT MCDOUGAL
Publisher:HOLT MCDOUGAL
Hypothesis Testing using Confidence Interval Approach; Author: BUM2413 Applied Statistics UMP;https://www.youtube.com/watch?v=Hq1l3e9pLyY;License: Standard YouTube License, CC-BY
Hypothesis Testing - Difference of Two Means - Student's -Distribution & Normal Distribution; Author: The Organic Chemistry Tutor;https://www.youtube.com/watch?v=UcZwyzwWU7o;License: Standard Youtube License