
Intro STATS, Books a la Carte Plus New Mystatlab with Pearson Etext -- Access Card Package
4th Edition
ISBN: 9780321869852
Author: Richard D. De Veaux
Publisher: PEARSON
expand_more
expand_more
format_list_bulleted
Concept explainers
Videos
Textbook Question
Chapter 23, Problem 47E
Ozone and population The Environmental Protection Agency is examining the relationship between the ozone level (in parts per million) and the population (in millions) of U.S. cities. Part of the
Dependent variable is Ozone
R-squared = 84.4%
s = 5.454 with 16 – 2 = 14 df
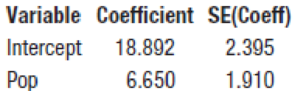
- a) We suspect that the ozone level is related to the population of a city. Is the relationship statistically significant? Assuming the conditions for inference are satisfied, test an appropriate hypothesis and state your conclusion in context.
- b) Do you think that the population of a city is a useful predictor of ozone level? Use the values of both R2 and s in your explanation.
Expert Solution & Answer
Want to see the full answer?
Check out a sample textbook solution
Students have asked these similar questions
Harvard University
California Institute of Technology
Massachusetts Institute of Technology
Stanford University
Princeton University
University of Cambridge
University of Oxford
University of California, Berkeley
Imperial College London
Yale University
University of California, Los Angeles
University of Chicago
Johns Hopkins University
Cornell University
ETH Zurich
University of Michigan
University of Toronto
Columbia University
University of Pennsylvania
Carnegie Mellon University
University of Hong Kong
University College London
University of Washington
Duke University
Northwestern University
University of Tokyo
Georgia Institute of Technology
Pohang University of Science and Technology
University of California, Santa Barbara
University of British Columbia
University of North Carolina at Chapel Hill
University of California, San Diego
University of Illinois at Urbana-Champaign
National University of Singapore
McGill…
Name
Harvard University
California Institute of Technology
Massachusetts Institute of Technology
Stanford University
Princeton University
University of Cambridge
University of Oxford
University of California, Berkeley
Imperial College London
Yale University
University of California, Los Angeles
University of Chicago
Johns Hopkins University
Cornell University
ETH Zurich
University of Michigan
University of Toronto
Columbia University
University of Pennsylvania
Carnegie Mellon University
University of Hong Kong
University College London
University of Washington
Duke University
Northwestern University
University of Tokyo
Georgia Institute of Technology
Pohang University of Science and Technology
University of California, Santa Barbara
University of British Columbia
University of North Carolina at Chapel Hill
University of California, San Diego
University of Illinois at Urbana-Champaign
National University of Singapore…
A company found that the daily sales revenue of its flagship product follows a normal distribution with a mean of $4500 and a standard deviation of $450. The company defines a "high-sales day" that is, any day with sales exceeding $4800. please provide a step by step on how to get the answers in excel
Q: What percentage of days can the company expect to have "high-sales days" or sales greater than $4800?
Q: What is the sales revenue threshold for the bottom 10% of days? (please note that 10% refers to the probability/area under bell curve towards the lower tail of bell curve)
Provide answers in the yellow cells
Chapter 23 Solutions
Intro STATS, Books a la Carte Plus New Mystatlab with Pearson Etext -- Access Card Package
Ch. 23.4 - Researchers in Food Science studied how big...Ch. 23.4 - Prob. 2JCCh. 23.4 - Prob. 3JCCh. 23 - Prob. 1ECh. 23 - Prob. 2ECh. 23 - Prob. 3ECh. 23 - Prob. 4ECh. 23 - Prob. 5ECh. 23 - Prob. 6ECh. 23 - Prob. 7E
Ch. 23 - Prob. 8ECh. 23 - Prob. 9ECh. 23 - Prob. 10ECh. 23 - Prob. 11ECh. 23 - 12. Shoot to score, double overtime One of the...Ch. 23 - Prob. 13ECh. 23 - Prob. 14ECh. 23 - Prob. 15ECh. 23 - Prob. 16ECh. 23 - Prob. 17ECh. 23 - Prob. 18ECh. 23 - Prob. 19ECh. 23 - Prob. 20ECh. 23 - Prob. 21ECh. 23 - Prob. 22ECh. 23 - Prob. 23ECh. 23 - Prob. 24ECh. 23 - Prob. 25ECh. 23 - Prob. 26ECh. 23 - Prob. 27ECh. 23 - Prob. 28ECh. 23 - Prob. 29ECh. 23 - Prob. 30ECh. 23 - Prob. 31ECh. 23 - Prob. 32ECh. 23 - Prob. 33ECh. 23 - Prob. 34ECh. 23 - Fuel economy A consumer organization has reported...Ch. 23 - 36. SAT scores How strong was the association...Ch. 23 - Prob. 37ECh. 23 - 38. SATs, part II Consider the high school SAT...Ch. 23 - 39. Fuel economy, part III Consider again the data...Ch. 23 - 40. SATs, again Consider the high school SAT...Ch. 23 - Cereals A healthy cereal should be low in both...Ch. 23 - Brain size Does your IQ depend on the size of your...Ch. 23 - Prob. 43ECh. 23 - Prob. 44ECh. 23 - Prob. 45ECh. 23 - Prob. 46ECh. 23 - Ozone and population The Environmental Protection...Ch. 23 - Prob. 48ECh. 23 - Prob. 49ECh. 23 - 50. More sales and profits Consider again the...Ch. 23 - Prob. 51ECh. 23 - Crawling Researchers at the University of Denver...Ch. 23 - 53. Body fat Do the data shown in the table below...Ch. 23 - Prob. 54ECh. 23 - Midterms The data set below shows midterm and...Ch. 23 - Prob. 56ECh. 23 - Prob. 57ECh. 23 - All the efficiency money can buy 2011 A sample of...Ch. 23 - Education and mortality The following software...Ch. 23 - Property assessments The following software output...Ch. 23 - Prob. 61ECh. 23 - Prob. 62E
Knowledge Booster


Learn more about
Need a deep-dive on the concept behind this application? Look no further. Learn more about this topic, statistics and related others by exploring similar questions and additional content below.Similar questions
- Find the critical value for a left-tailed test using the F distribution with a 0.025, degrees of freedom in the numerator=12, and degrees of freedom in the denominator = 50. A portion of the table of critical values of the F-distribution is provided. Click the icon to view the partial table of critical values of the F-distribution. What is the critical value? (Round to two decimal places as needed.)arrow_forwardA retail store manager claims that the average daily sales of the store are $1,500. You aim to test whether the actual average daily sales differ significantly from this claimed value. You can provide your answer by inserting a text box and the answer must include: Null hypothesis, Alternative hypothesis, Show answer (output table/summary table), and Conclusion based on the P value. Showing the calculation is a must. If calculation is missing,so please provide a step by step on the answers Numerical answers in the yellow cellsarrow_forwardShow all workarrow_forward
- Show all workarrow_forwardplease find the answers for the yellows boxes using the information and the picture belowarrow_forwardA marketing agency wants to determine whether different advertising platforms generate significantly different levels of customer engagement. The agency measures the average number of daily clicks on ads for three platforms: Social Media, Search Engines, and Email Campaigns. The agency collects data on daily clicks for each platform over a 10-day period and wants to test whether there is a statistically significant difference in the mean number of daily clicks among these platforms. Conduct ANOVA test. You can provide your answer by inserting a text box and the answer must include: also please provide a step by on getting the answers in excel Null hypothesis, Alternative hypothesis, Show answer (output table/summary table), and Conclusion based on the P value.arrow_forward
arrow_back_ios
SEE MORE QUESTIONS
arrow_forward_ios
Recommended textbooks for you
 Glencoe Algebra 1, Student Edition, 9780079039897...AlgebraISBN:9780079039897Author:CarterPublisher:McGraw Hill
 College AlgebraAlgebraISBN:9781305115545Author:James Stewart, Lothar Redlin, Saleem WatsonPublisher:Cengage Learning
 Big Ideas Math A Bridge To Success Algebra 1: Stu...AlgebraISBN:9781680331141Author:HOUGHTON MIFFLIN HARCOURTPublisher:Houghton Mifflin Harcourt
 Functions and Change: A Modeling Approach to Coll...AlgebraISBN:9781337111348Author:Bruce Crauder, Benny Evans, Alan NoellPublisher:Cengage Learning
 Algebra and Trigonometry (MindTap Course List)AlgebraISBN:9781305071742Author:James Stewart, Lothar Redlin, Saleem WatsonPublisher:Cengage Learning
Glencoe Algebra 1, Student Edition, 9780079039897...
Algebra
ISBN:9780079039897
Author:Carter
Publisher:McGraw Hill
College Algebra
Algebra
ISBN:9781305115545
Author:James Stewart, Lothar Redlin, Saleem Watson
Publisher:Cengage Learning
Big Ideas Math A Bridge To Success Algebra 1: Stu...
Algebra
ISBN:9781680331141
Author:HOUGHTON MIFFLIN HARCOURT
Publisher:Houghton Mifflin Harcourt
Functions and Change: A Modeling Approach to Coll...
Algebra
ISBN:9781337111348
Author:Bruce Crauder, Benny Evans, Alan Noell
Publisher:Cengage Learning
Algebra and Trigonometry (MindTap Course List)
Algebra
ISBN:9781305071742
Author:James Stewart, Lothar Redlin, Saleem Watson
Publisher:Cengage Learning
Correlation Vs Regression: Difference Between them with definition & Comparison Chart; Author: Key Differences;https://www.youtube.com/watch?v=Ou2QGSJVd0U;License: Standard YouTube License, CC-BY
Correlation and Regression: Concepts with Illustrative examples; Author: LEARN & APPLY : Lean and Six Sigma;https://www.youtube.com/watch?v=xTpHD5WLuoA;License: Standard YouTube License, CC-BY