
Concept explainers
Videos
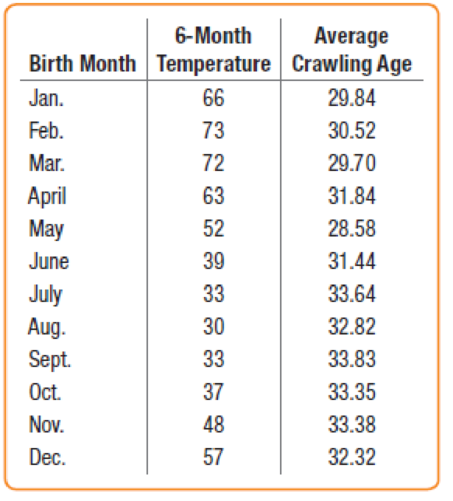
Crawling Researchers at the University of Denver Infant Study Center wondered whether temperature might influence the age at which babies learn to crawl. Perhaps the extra clothing that babies wear in cold weather would restrict movement and delay the age at which they started crawling. Data were collected on 208 boys and 206 girls. Parents reported the month of the baby’s birth and the age (in weeks) at which their child first crawled. The table gives the average Temperature (°F) when the babies were 6 months old and average Crawling Age (in weeks) for each month of the year. Make the plots and compute the analyses necessary to answer the following questions. (Janette B. Benson, “Season of birth and onset of locomotion: Theoretical and methodological implications, “Infant Behavior and Development 16(1): 69–81, 1993.)
- a) Would this association appear to be weaker, stronger, or the same if data had been plotted for individual babies instead of using monthly averages? Explain.
- b) Is there evidence of an association between Temperature and Crawling Age? Test an appropriate hypothesis and state your conclusion. Don’t forget to check the assumptions.
- c) Create and interpret a 95% confidence interval for the slope of the true relationship.
Want to see the full answer?
Check out a sample textbook solution
Chapter 23 Solutions
Intro STATS, Books a la Carte Plus New Mystatlab with Pearson Etext -- Access Card Package


- Show all workarrow_forwardplease find the answers for the yellows boxes using the information and the picture belowarrow_forwardA marketing agency wants to determine whether different advertising platforms generate significantly different levels of customer engagement. The agency measures the average number of daily clicks on ads for three platforms: Social Media, Search Engines, and Email Campaigns. The agency collects data on daily clicks for each platform over a 10-day period and wants to test whether there is a statistically significant difference in the mean number of daily clicks among these platforms. Conduct ANOVA test. You can provide your answer by inserting a text box and the answer must include: also please provide a step by on getting the answers in excel Null hypothesis, Alternative hypothesis, Show answer (output table/summary table), and Conclusion based on the P value.arrow_forward
- A company found that the daily sales revenue of its flagship product follows a normal distribution with a mean of $4500 and a standard deviation of $450. The company defines a "high-sales day" that is, any day with sales exceeding $4800. please provide a step by step on how to get the answers Q: What percentage of days can the company expect to have "high-sales days" or sales greater than $4800? Q: What is the sales revenue threshold for the bottom 10% of days? (please note that 10% refers to the probability/area under bell curve towards the lower tail of bell curve) Provide answers in the yellow cellsarrow_forwardBusiness Discussarrow_forwardThe following data represent total ventilation measured in liters of air per minute per square meter of body area for two independent (and randomly chosen) samples. Analyze these data using the appropriate non-parametric hypothesis testarrow_forward
 Big Ideas Math A Bridge To Success Algebra 1: Stu...AlgebraISBN:9781680331141Author:HOUGHTON MIFFLIN HARCOURTPublisher:Houghton Mifflin Harcourt
 Glencoe Algebra 1, Student Edition, 9780079039897...AlgebraISBN:9780079039897Author:CarterPublisher:McGraw Hill
 Holt Mcdougal Larson Pre-algebra: Student Edition...AlgebraISBN:9780547587776Author:HOLT MCDOUGALPublisher:HOLT MCDOUGAL
 College Algebra (MindTap Course List)AlgebraISBN:9781305652231Author:R. David Gustafson, Jeff HughesPublisher:Cengage Learning
 Trigonometry (MindTap Course List)TrigonometryISBN:9781305652224Author:Charles P. McKeague, Mark D. TurnerPublisher:Cengage Learning
 Functions and Change: A Modeling Approach to Coll...AlgebraISBN:9781337111348Author:Bruce Crauder, Benny Evans, Alan NoellPublisher:Cengage Learning