Nature of Mathematics (MindTap Course List)
13th Edition
ISBN: 9781133947257
Author: karl J. smith
Publisher: Cengage Learning
expand_more
expand_more
format_list_bulleted
Concept explainers
Videos
Textbook Question
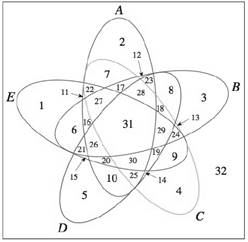
Chapter 2.3, Problem 57PS
The Venn diagram in Figure
 |
||||
| FIGURE
|
||||
| a.
|
b.
|
c.
|
d.
|
e.
|
Expert Solution & Answer
Want to see the full answer?
Check out a sample textbook solution
Students have asked these similar questions
Find the derivative of the function.
y= (8x²-6x²+3)4
Find f[g(x)] and g[f(x)].
f(x)=√√x+5, g(x) = 12x² -
Find the derivative of the following function.
-2
y =
(3x+7)³
Chapter 2 Solutions
Nature of Mathematics (MindTap Course List)
Ch. 2.1 - Prob. 1PSCh. 2.1 - IN YOUR OWN WORDS Distinguish between equal and...Ch. 2.1 - Prob. 3PSCh. 2.1 - Prob. 4PSCh. 2.1 - Tell whether each set in Problems 5-8 is well...Ch. 2.1 - Prob. 6PSCh. 2.1 - Tell whether each set in Problems 5-8 is well...Ch. 2.1 - Tell whether each set in Problems 5-8 is well...Ch. 2.1 - Specify the sets in Problems 9-14 by roster. a....Ch. 2.1 - Specify the sets in Problems 9-14 by roster. a....
Ch. 2.1 - Prob. 11PSCh. 2.1 - Prob. 12PSCh. 2.1 - Specify the sets in Problems 9-14 by roster. a....Ch. 2.1 - Specify the sets in Problems 9-14 by roster. a....Ch. 2.1 - Prob. 15PSCh. 2.1 - Prob. 16PSCh. 2.1 - Prob. 17PSCh. 2.1 - Prob. 18PSCh. 2.1 - Prob. 19PSCh. 2.1 - Prob. 20PSCh. 2.1 - Prob. 21PSCh. 2.1 - Prob. 22PSCh. 2.1 - Prob. 23PSCh. 2.1 - Prob. 24PSCh. 2.1 - Prob. 25PSCh. 2.1 - Prob. 26PSCh. 2.1 - Prob. 27PSCh. 2.1 - Prob. 28PSCh. 2.1 - Prob. 29PSCh. 2.1 - Prob. 30PSCh. 2.1 - Prob. 31PSCh. 2.1 - Prob. 32PSCh. 2.1 - Prob. 33PSCh. 2.1 - Prob. 34PSCh. 2.1 - Prob. 35PSCh. 2.1 - Prob. 36PSCh. 2.1 - Prob. 37PSCh. 2.1 - Prob. 38PSCh. 2.1 - Prob. 39PSCh. 2.1 - Prob. 40PSCh. 2.1 - Prob. 41PSCh. 2.1 - Prob. 42PSCh. 2.1 - Prob. 43PSCh. 2.1 - Prob. 44PSCh. 2.1 - Prob. 45PSCh. 2.1 - Prob. 46PSCh. 2.1 - Prob. 47PSCh. 2.1 - Prob. 48PSCh. 2.1 - Prob. 49PSCh. 2.1 - Decide whether each statement in Problems 46-54 is...Ch. 2.1 - Prob. 51PSCh. 2.1 - Prob. 52PSCh. 2.1 - Prob. 53PSCh. 2.1 - Prob. 54PSCh. 2.1 - Prob. 55PSCh. 2.1 - Prob. 56PSCh. 2.1 - Prob. 57PSCh. 2.1 - Five people plan to meet after school, and if they...Ch. 2.1 - Prob. 59PSCh. 2.1 - Prob. 60PSCh. 2.2 - Prob. 1PSCh. 2.2 - Prob. 2PSCh. 2.2 - Prob. 3PSCh. 2.2 - Prob. 4PSCh. 2.2 - Prob. 5PSCh. 2.2 - Prob. 6PSCh. 2.2 - Prob. 7PSCh. 2.2 - Prob. 8PSCh. 2.2 - Prob. 9PSCh. 2.2 - Prob. 10PSCh. 2.2 - Prob. 11PSCh. 2.2 - Prob. 12PSCh. 2.2 - Prob. 13PSCh. 2.2 - Prob. 14PSCh. 2.2 - Prob. 15PSCh. 2.2 - Prob. 16PSCh. 2.2 - Prob. 17PSCh. 2.2 - Prob. 18PSCh. 2.2 - Prob. 19PSCh. 2.2 - Prob. 20PSCh. 2.2 - Prob. 21PSCh. 2.2 - Prob. 22PSCh. 2.2 - Prob. 23PSCh. 2.2 - Prob. 24PSCh. 2.2 - Prob. 25PSCh. 2.2 - Prob. 26PSCh. 2.2 - Prob. 27PSCh. 2.2 - Prob. 28PSCh. 2.2 - Prob. 29PSCh. 2.2 - Prob. 30PSCh. 2.2 - Prob. 31PSCh. 2.2 - Prob. 32PSCh. 2.2 - Prob. 33PSCh. 2.2 - Prob. 34PSCh. 2.2 - Prob. 35PSCh. 2.2 - Prob. 36PSCh. 2.2 - Prob. 37PSCh. 2.2 - Prob. 38PSCh. 2.2 - Prob. 39PSCh. 2.2 - Prob. 40PSCh. 2.2 - Prob. 41PSCh. 2.2 - Prob. 42PSCh. 2.2 - Prob. 43PSCh. 2.2 - Prob. 44PSCh. 2.2 - Prob. 45PSCh. 2.2 - Prob. 46PSCh. 2.2 - Prob. 47PSCh. 2.2 - Prob. 48PSCh. 2.2 - Draw Venn diagrams for each of the relationships...Ch. 2.2 - Prob. 50PSCh. 2.2 - Draw Venn diagrams for each of the relationships...Ch. 2.2 - Prob. 52PSCh. 2.2 - Prob. 53PSCh. 2.2 - Level 2 From a survey of 100 college students, a...Ch. 2.2 - Level 2 In a survey of a TriDelt chapter with 50...Ch. 2.2 - Prob. 56PSCh. 2.2 - Prob. 57PSCh. 2.2 - Santa Rosa Junior College enrolled 29,000 students...Ch. 2.2 - Prob. 59PSCh. 2.2 - Prob. 60PSCh. 2.3 - What do we mean by De Morgans laws?Ch. 2.3 - Prob. 2PSCh. 2.3 - Prob. 3PSCh. 2.3 - Prob. 4PSCh. 2.3 - Prob. 5PSCh. 2.3 - Prob. 6PSCh. 2.3 - Prob. 7PSCh. 2.3 - Prob. 8PSCh. 2.3 - Prob. 9PSCh. 2.3 - Prob. 10PSCh. 2.3 - Prob. 11PSCh. 2.3 - Prob. 12PSCh. 2.3 - Prob. 13PSCh. 2.3 - Prob. 14PSCh. 2.3 - Prob. 15PSCh. 2.3 - Prob. 16PSCh. 2.3 - Prob. 17PSCh. 2.3 - Prob. 18PSCh. 2.3 - Prob. 19PSCh. 2.3 - Prob. 20PSCh. 2.3 - Prob. 21PSCh. 2.3 - Prob. 22PSCh. 2.3 - Prob. 23PSCh. 2.3 - Prob. 24PSCh. 2.3 - Prob. 25PSCh. 2.3 - Prob. 26PSCh. 2.3 - Prob. 27PSCh. 2.3 - Prob. 28PSCh. 2.3 - Prob. 29PSCh. 2.3 - Prob. 30PSCh. 2.3 - Prob. 31PSCh. 2.3 - Prob. 32PSCh. 2.3 - Prob. 33PSCh. 2.3 - Prob. 34PSCh. 2.3 - Prob. 35PSCh. 2.3 - Draw a Venn diagram showing the relationship among...Ch. 2.3 - Prob. 37PSCh. 2.3 - Prob. 38PSCh. 2.3 - In Problems 3944, use set notation to identify the...Ch. 2.3 - In Problems 3944, use set notation to identify the...Ch. 2.3 - In Problems 3944, use set notation to identify the...Ch. 2.3 - Prob. 42PSCh. 2.3 - Prob. 43PSCh. 2.3 - Prob. 44PSCh. 2.3 - Prob. 45PSCh. 2.3 - Prob. 46PSCh. 2.3 - Prob. 47PSCh. 2.3 - Prob. 48PSCh. 2.3 - Prob. 49PSCh. 2.3 - Prob. 50PSCh. 2.3 - In a recent survey of 100 persons, the following...Ch. 2.3 - Matt E. Matic was applying for a job. To determine...Ch. 2.3 - A poll was taken of 100 students at a commuter...Ch. 2.3 - Prob. 54PSCh. 2.3 - Prob. 55PSCh. 2.3 - Prob. 56PSCh. 2.3 - The Venn diagram in Figure 2.17 shows five sets....Ch. 2.3 - Prob. 58PSCh. 2.3 - Prob. 59PSCh. 2.3 - Human blood is typed Rh + positive blood of Rh ...Ch. 2.4 - IN YOUR OWN WORDS Why do you think the fundamental...Ch. 2.4 - Prob. 2PSCh. 2.4 - Prob. 3PSCh. 2.4 - Prob. 4PSCh. 2.4 - Prob. 5PSCh. 2.4 - Prob. 6PSCh. 2.4 - Prob. 7PSCh. 2.4 - Prob. 8PSCh. 2.4 - Prob. 9PSCh. 2.4 - Prob. 10PSCh. 2.4 - Prob. 11PSCh. 2.4 - Prob. 12PSCh. 2.4 - Prob. 13PSCh. 2.4 - Prob. 14PSCh. 2.4 - Prob. 15PSCh. 2.4 - Prob. 16PSCh. 2.4 - Prob. 17PSCh. 2.4 - Prob. 18PSCh. 2.4 - Prob. 19PSCh. 2.4 - Prob. 20PSCh. 2.4 - Prob. 21PSCh. 2.4 - Prob. 22PSCh. 2.4 - Prob. 23PSCh. 2.4 - Prob. 24PSCh. 2.4 - Prob. 25PSCh. 2.4 - Prob. 26PSCh. 2.4 - Prob. 27PSCh. 2.4 - Prob. 28PSCh. 2.4 - Prob. 29PSCh. 2.4 - Show that the following sets have the same...Ch. 2.4 - Prob. 31PSCh. 2.4 - Prob. 32PSCh. 2.4 - Prob. 33PSCh. 2.4 - Prob. 34PSCh. 2.4 - Prob. 35PSCh. 2.4 - Prob. 36PSCh. 2.4 - Prob. 37PSCh. 2.4 - Prob. 38PSCh. 2.4 - Prob. 39PSCh. 2.4 - Prob. 40PSCh. 2.4 - Prob. 41PSCh. 2.4 - Prob. 42PSCh. 2.4 - Prob. 43PSCh. 2.4 - Prob. 44PSCh. 2.4 - Prob. 45PSCh. 2.4 - Prob. 46PSCh. 2.4 - Prob. 47PSCh. 2.4 - Prob. 48PSCh. 2.4 - Prob. 49PSCh. 2.4 - Prob. 50PSCh. 2.4 - Prob. 51PSCh. 2.4 - Prob. 52PSCh. 2.4 - Prob. 53PSCh. 2.4 - Prob. 54PSCh. 2.4 - Prob. 55PSCh. 2.4 - Prob. 56PSCh. 2.4 - Prob. 57PSCh. 2.4 - Prob. 58PSCh. 2.4 - Prob. 59PSCh. 2.4 - Prob. 60PSCh. 2.CR - Prob. 1CRCh. 2.CR - Prob. 2CRCh. 2.CR - Prob. 3CRCh. 2.CR - Prob. 4CRCh. 2.CR - Prob. 5CRCh. 2.CR - Prob. 6CRCh. 2.CR - Prob. 7CRCh. 2.CR - Prob. 8CRCh. 2.CR - Prob. 9CRCh. 2.CR - Prob. 10CRCh. 2.CR - Prob. 11CRCh. 2.CR - Prob. 12CRCh. 2.CR - Prob. 13CRCh. 2.CR - Prob. 14CRCh. 2.CR - Prob. 15CRCh. 2.CR - Prob. 16CRCh. 2.CR - Prob. 17CRCh. 2.CR - Human blood is typed Rh+ positive blood or Rh...Ch. 2.CR - Prob. 19CRCh. 2.CR - Prob. 20CR
Knowledge Booster


Learn more about
Need a deep-dive on the concept behind this application? Look no further. Learn more about this topic, subject and related others by exploring similar questions and additional content below.Similar questions
- Find all values of x for the given function where the tangent line is horizontal. 3 =√x³-12x² + 45x+5arrow_forwardFind the equation of the tangent line to the graph of the given function at the given value of x. 6 f(x) = x(x² - 4x+5)*; x=2arrow_forward7. Suppose that X is a set, that I is a nonempty set, and that for each i Є I that Yi is a set. Suppose that I is a nonempty set. Prove the following:2 (a) If Y; CX for all i EI, then Uiel Yi C X. ¹See Table 4.8.1 in zyBooks. Recall: Nie X₁ = Vi Є I (x = X₁) and x = Uier X₁ = i Є I (x Є Xi). (b) If XCY; for all i Є I, then X Ciel Yi. (c) U(x)=xnUY. iЄI ΕΙarrow_forward
arrow_back_ios
SEE MORE QUESTIONS
arrow_forward_ios
Recommended textbooks for you
 Algebra: Structure And Method, Book 1AlgebraISBN:9780395977224Author:Richard G. Brown, Mary P. Dolciani, Robert H. Sorgenfrey, William L. ColePublisher:McDougal Littell
 Elementary Geometry For College Students, 7eGeometryISBN:9781337614085Author:Alexander, Daniel C.; Koeberlein, Geralyn M.Publisher:Cengage,
 Mathematics For Machine TechnologyAdvanced MathISBN:9781337798310Author:Peterson, John.Publisher:Cengage Learning,
 Elementary Geometry for College StudentsGeometryISBN:9781285195698Author:Daniel C. Alexander, Geralyn M. KoeberleinPublisher:Cengage Learning
Algebra: Structure And Method, Book 1
Algebra
ISBN:9780395977224
Author:Richard G. Brown, Mary P. Dolciani, Robert H. Sorgenfrey, William L. Cole
Publisher:McDougal Littell
Elementary Geometry For College Students, 7e
Geometry
ISBN:9781337614085
Author:Alexander, Daniel C.; Koeberlein, Geralyn M.
Publisher:Cengage,
Mathematics For Machine Technology
Advanced Math
ISBN:9781337798310
Author:Peterson, John.
Publisher:Cengage Learning,
Elementary Geometry for College Students
Geometry
ISBN:9781285195698
Author:Daniel C. Alexander, Geralyn M. Koeberlein
Publisher:Cengage Learning
Probability & Statistics (28 of 62) Basic Definitions and Symbols Summarized; Author: Michel van Biezen;https://www.youtube.com/watch?v=21V9WBJLAL8;License: Standard YouTube License, CC-BY
Introduction to Probability, Basic Overview - Sample Space, & Tree Diagrams; Author: The Organic Chemistry Tutor;https://www.youtube.com/watch?v=SkidyDQuupA;License: Standard YouTube License, CC-BY