
Elementary Statistics: Picturing the World (7th Edition)
7th Edition
ISBN: 9780134683416
Author: Ron Larson, Betsy Farber
Publisher: PEARSON
expand_more
expand_more
format_list_bulleted
Videos
Textbook Question
Chapter 2.3, Problem 35E
Graphical Analysis In Exercises 35 and 36, identify any clusters, gaps, or outliers.
35. Model Year 2017 Ethanol Flexible Fuel Vehicles
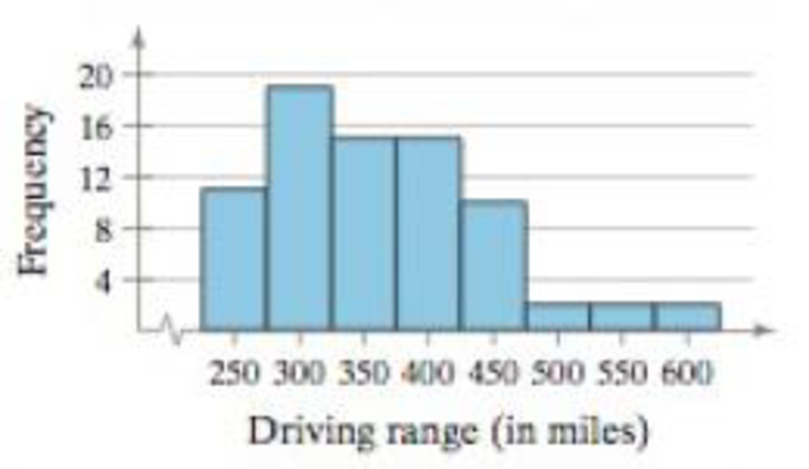
(Source: United States Environmental Protection Agency)
Expert Solution & Answer
Want to see the full answer?
Check out a sample textbook solution
Students have asked these similar questions
A quality characteristic of a product is normally distributed with mean μ and standard deviation σ = 1. Speci-
fications on the characteristic are 6≤x≤8. A unit that falls within specifications on this quality characteristic
results in a profit of Co. However, if x 8, the profit is -C2. Find the value
ofμ that maximizes the expected profit.
A) The output voltage of a power supply is normally distributed with mean 5 V and standard deviation 0.02 V. If
the lower and upper specifications for voltage are 4.95 V and 5.05 V, respectively, what is the probability that a
power supply selected at random conform to the specifications on voltage?
B)
Continuation of A. Reconsider the power supply manufacturing process in A. Suppose
We wanted to improve the process. Can shifting the mean reduce the number of nonconforming units produced?
How much would the process variability need to be reduced in order to have all but one out of 1000 units conform
to the specifications?
der to complete the Case X
T Civil Service Numerical Test Sec X T Casework Skills Practice Test
Maseline
Vaseline
x +
euauthoring.panpowered.com/DeliveryWeb/Civil Service Main/84589a48-6934-4b6e-a6e1-a5d75f559df9?transferToken-News NGSSON
The table below shows the best price available for various items from 4 uniform suppliers. The prices do not include VAT
(charged at 20%).
Item
Waterproof boots
A1-Uniforms (£)Best Trade (£)Clothing Tech (£)Dress Right (£)
59.99
39.99
59.99
49.99
Trousers
9.89
9.98
9.99
11.99
Shirts
14.99
15.99
16.99
12.99
Hi-Vis vest
4.49
4.50
4.00
4.00
20.00
25.00
19.50
19.99
Hard hats
A company needs to buy a set of 12 uniforms which includes 1 of each item. If the special offers are included
which supplier is cheapest?
OOO
A1-Uniforms
Best Trade
Clothing Tech
Q Search
+
**
109
8
CO*
F10
Home
F11
F12
6
Chapter 2 Solutions
Elementary Statistics: Picturing the World (7th Edition)
Ch. 2.1 - Construct a frequency distribution using the...Ch. 2.1 - Using the frequency distribution constructed in...Ch. 2.1 - Use the frequency distribution from Try It...Ch. 2.1 - Use the frequency distribution from Try It...Ch. 2.1 - Use the frequency distribution in Try It Yourself...Ch. 2.1 - Use the frequency distribution from Try It...Ch. 2.1 - Use technology and the frequency distribution from...Ch. 2.1 - What are some benefits of representing data sets...Ch. 2.1 - Why should the number of classes in a frequency...Ch. 2.1 - What is the difference between class limits and...
Ch. 2.1 - What is the difference between relative frequency...Ch. 2.1 - After constructing an expanded frequency...Ch. 2.1 - What is the difference between a frequency polygon...Ch. 2.1 - True or False? In Exercises 710, determine whether...Ch. 2.1 - True or False? In Exercises 710, determine whether...Ch. 2.1 - True or False? In Exercises 710, determine whether...Ch. 2.1 - Prob. 10ECh. 2.1 - In Exercises 1114, use the minimum and maximum...Ch. 2.1 - In Exercises 1114, use the minimum and maximum...Ch. 2.1 - In Exercises 1114, use the minimum and maximum...Ch. 2.1 - In Exercises 1114, use the minimum and maximum...Ch. 2.1 - Reading a Frequency Distribution In Exercises 15...Ch. 2.1 - Reading a Frequency Distribution In Exercises 15...Ch. 2.1 - Use the frequency distribution in Exercise 15 to...Ch. 2.1 - Use the frequency distribution in Exercise 16 to...Ch. 2.1 - Graphical Analysis In Exercises 19 and 20, use the...Ch. 2.1 - Graphical Analysis In Exercises 19 and 20, use the...Ch. 2.1 - Graphical Analysis In Exercises 21 and 22, use the...Ch. 2.1 - Graphical Analysis In Exercises 21 and 22, use the...Ch. 2.1 - Graphical Analysis In Exercises 23 and 24, use the...Ch. 2.1 - Graphical Analysis In Exercises 23 and 24, use the...Ch. 2.1 - Prob. 25ECh. 2.1 - Graphical Analysis In Exercises 25 and 26, use the...Ch. 2.1 - Use the ogive in Exercise 25 to approximate (a)...Ch. 2.1 - Use the ogive in Exercise 26 to approximate (a)...Ch. 2.1 - Constructing a Frequency Distribution In Exercises...Ch. 2.1 - Constructing a Frequency Distribution In Exercises...Ch. 2.1 - Constructing a Frequency Distribution and a...Ch. 2.1 - Constructing a Frequency Distribution and a...Ch. 2.1 - Constructing a Frequency Distribution and a...Ch. 2.1 - Constructing a Frequency Distribution and a...Ch. 2.1 - Constructing a Frequency Distribution and a...Ch. 2.1 - Constructing a Frequency Distribution and a...Ch. 2.1 - Constructing a Frequency Distribution and a...Ch. 2.1 - Constructing a Frequency Distribution and a...Ch. 2.1 - Constructing a Frequency Distribution and a...Ch. 2.1 - Constructing a Frequency Distribution and a...Ch. 2.1 - Constructing a Cumulative Frequency Distribution...Ch. 2.1 - Constructing a Cumulative Frequency Distribution...Ch. 2.1 - In Exercises 43 and 44, use the data set and the...Ch. 2.1 - In Exercises 43 and 44, use the data set and the...Ch. 2.1 - What Would You Do? You work at a bank and are...Ch. 2.1 - What Would You Do? The admissions department for a...Ch. 2.1 - Writing Use the data set listed and technology to...Ch. 2.2 - Use a stem-and-leaf plot to organize the points...Ch. 2.2 - Using two rows for each stem, revise the...Ch. 2.2 - Use a dot plot to organize the points scored by...Ch. 2.2 - The numbers of earned degrees conferred (in...Ch. 2.2 - Every year, the Better Business Bureau (BBB)...Ch. 2.2 - The lengths of employment and the salaries of 10...Ch. 2.2 - Use the table in Example 7 to construct a time...Ch. 2.2 - Name some ways to display quantitative data...Ch. 2.2 - What is an advantage of using a stem-and-leaf plot...Ch. 2.2 - In terms of displaying data, how is a...Ch. 2.2 - How is a Pareto chart different from a standard...Ch. 2.2 - Putting Graphs in Context In Exercises 58, match...Ch. 2.2 - Putting Graphs in Context In Exercises 58, match...Ch. 2.2 - Putting Graphs in Context In Exercises 58, match...Ch. 2.2 - Putting Graphs in Context In Exercises 58, match...Ch. 2.2 - Graphical Analysis In Exercises 912, use the...Ch. 2.2 - Graphical Analysis In Exercises 912, use the...Ch. 2.2 - Graphical Analysis In Exercises 912, use the...Ch. 2.2 - Prob. 12ECh. 2.2 - Graphical Analysis In Exercises 1316, give three...Ch. 2.2 - Graphical Analysis In Exercises 1316, give three...Ch. 2.2 - Graphical Analysis In Exercises 1316, give three...Ch. 2.2 - Graphical Analysis In Exercises 1316, give three...Ch. 2.2 - Graphing Data Sets In Exercises 1732, organize the...Ch. 2.2 - Graphing Data Sets In Exercises 1732, organize the...Ch. 2.2 - Prob. 19ECh. 2.2 - Graphing Data Sets In Exercises 1732, organize the...Ch. 2.2 - Graphing Data Sets In Exercises 1732, organize the...Ch. 2.2 - Graphing Data Sets In Exercises 1732, organize the...Ch. 2.2 - Graphing Data Sets In Exercises 1732, organize the...Ch. 2.2 - Graphing Data Sets In Exercises 1732, organize the...Ch. 2.2 - Graphing Data Sets In Exercises 1732, organize the...Ch. 2.2 - Graphing Data Sets In Exercises 1732, organize the...Ch. 2.2 - Graphing Data Sets In Exercises 1732, organize the...Ch. 2.2 - Graphing Data Sets In Exercises 1732, organize the...Ch. 2.2 - Hourly Wages Use a scatter plot to display the...Ch. 2.2 - Salaries Use a scatter plot to display the data...Ch. 2.2 - Engineering Degrees Use a time series chart to...Ch. 2.2 - Construction Use a time series chart to display...Ch. 2.2 - Basketball Display the data below in a...Ch. 2.2 - Phone Screen Sizes Display the data below in a dot...Ch. 2.2 - Favorite Season Display the data below in a Pareto...Ch. 2.2 - Favorite Day of the Week Display the data below in...Ch. 2.2 - A Misleading Graph? A misleading graph is not...Ch. 2.2 - Prob. 38ECh. 2.2 - A Misleading Graph? A misleading graph is not...Ch. 2.2 - Prob. 40ECh. 2.2 - Law Firm Salaries A back-to-back stem-and-leaf...Ch. 2.2 - Yoga Classes The data sets at the left show the...Ch. 2.2 - Choosing an Appropriate Display Use technology to...Ch. 2.3 - Find the mean of the points scored by the 51...Ch. 2.3 - Find the median of the points scored by the 51...Ch. 2.3 - The points scored by the winning teams in the...Ch. 2.3 - Find the mode of the points scored by the 51...Ch. 2.3 - In a survey, 1534 adults were asked, How much do...Ch. 2.3 - Remove the data entry 65 from the data set in...Ch. 2.3 - In Example 7, your grade in the two-credit course...Ch. 2.3 - Use a frequency distribution to estimate the mean...Ch. 2.3 - True or False? In Exercises 14, determine whether...Ch. 2.3 - True or False? In Exercises 14, determine whether...Ch. 2.3 - True or False? In Exercises 14, determine whether...Ch. 2.3 - True or False? In Exercises 14, determine whether...Ch. 2.3 - Constructing Data Sets In Exercises 58, construct...Ch. 2.3 - Constructing Data Sets In Exercises 58, construct...Ch. 2.3 - Mean is not representative of a typical number in...Ch. 2.3 - Prob. 8ECh. 2.3 - Graphical Analysis In Exercises 912, determine...Ch. 2.3 - Graphical Analysis In Exercises 912, determine...Ch. 2.3 - Graphical Analysis In Exercises 912, determine...Ch. 2.3 - Graphical Analysis In Exercises 912, determine...Ch. 2.3 - Graphical Analysis In Exercises 912, determine...Ch. 2.3 - Graphical Analysis In Exercises 912, determine...Ch. 2.3 - Graphical Analysis In Exercises 912, determine...Ch. 2.3 - Graphical Analysis In Exercises 912, determine...Ch. 2.3 - Finding and Discussing the Mean, Median, and Mode...Ch. 2.3 - Finding and Discussing the Mean, Median, and Mode...Ch. 2.3 - Finding and Discussing the Mean, Median, and Mode...Ch. 2.3 - Finding and Discussing the Mean, Median, and Mode...Ch. 2.3 - Finding and Discussing the Mean, Median, and Mode...Ch. 2.3 - Finding and Discussing the Mean, Median, and Mode...Ch. 2.3 - Finding and Discussing the Mean, Median, and Mode...Ch. 2.3 - Finding and Discussing the Mean, Median, and Mode...Ch. 2.3 - Prob. 25ECh. 2.3 - Finding and Discussing the Mean, Median, and Mode...Ch. 2.3 - Finding and Discussing the Mean, Median, and Mode...Ch. 2.3 - Prob. 28ECh. 2.3 - Finding and Discussing the Mean, Median, and Mode...Ch. 2.3 - Finding and Discussing the Mean, Median, and Mode...Ch. 2.3 - Finding and Discussing the Mean, Median, and Mode...Ch. 2.3 - Finding and Discussing the Mean, Median, and Mode...Ch. 2.3 - Finding and Discussing the Mean, Median, and Mode...Ch. 2.3 - Finding and Discussing the Mean, Median, and Mode...Ch. 2.3 - Graphical Analysis In Exercises 35 and 36,...Ch. 2.3 - Graphical Analysis In Exercises 35 and 36,...Ch. 2.3 - In Exercises 3740, without performing any...Ch. 2.3 - In Exercises 3740, without performing any...Ch. 2.3 - In Exercises 3740, without performing any...Ch. 2.3 - In Exercises 3740, without performing any...Ch. 2.3 - Finding a Weighted Mean In Exercises 4146, find...Ch. 2.3 - Finding a Weighted Mean In Exercises 4146, find...Ch. 2.3 - Finding a Weighted Mean In Exercises 4146, find...Ch. 2.3 - Finding a Weighted Mean In Exercises 4146, find...Ch. 2.3 - Finding a Weighted Mean In Exercises 4146, find...Ch. 2.3 - Finding a Weighted Mean In Exercises 4146, find...Ch. 2.3 - Finding a Weighted Mean In Exercises 4146, find...Ch. 2.3 - Finding a Weighted Mean In Exercises 4146, find...Ch. 2.3 - Finding the Mean of a Frequency Distribution In...Ch. 2.3 - Finding the Mean of a Frequency Distribution In...Ch. 2.3 - Finding the Mean of a Frequency Distribution In...Ch. 2.3 - Finding the Mean of a Frequency Distribution In...Ch. 2.3 - Identifying the Shape of a Distribution In...Ch. 2.3 - Identifying the Shape of a Distribution In...Ch. 2.3 - Identifying the Shape of a Distribution In...Ch. 2.3 - Identifying the Shape of a Distribution In...Ch. 2.3 - Protein Powder During a quality assurance check,...Ch. 2.3 - U.S. Trade Deficits The table at the left shows...Ch. 2.3 - Graphical Analysis In Exercises 59 and 60, the...Ch. 2.3 - Graphical Analysis In Exercises 59 and 60, the...Ch. 2.3 - Prob. 61ECh. 2.3 - Prob. 62ECh. 2.3 - Prob. 63ECh. 2.3 - Prob. 64ECh. 2.3 - Data Analysis Students in an experimental...Ch. 2.3 - Trimmed Mean To find the 10% trimmed mean of a...Ch. 2.3 - Specify the lower limit to be 1 and the upper...Ch. 2.3 - Specify the lower limit to be 0 and the upper...Ch. 2.4 - Find the range of the starting salaries for...Ch. 2.4 - Find the population variance and standard...Ch. 2.4 - Refer to the study in Example 3. The recovery...Ch. 2.4 - Sample office rental rates (in dollars per square...Ch. 2.4 - Write a data set that has 10 entries, a mean of...Ch. 2.4 - Estimate the percent of women ages 2029 whose...Ch. 2.4 - Apply Chebychevs Theorem to the data for Iowa...Ch. 2.4 - Change three of the 6s in the data set to 4s. How...Ch. 2.4 - In the frequency distribution in Example 9, 599.5...Ch. 2.4 - Find the coefficient of variation for the office...Ch. 2.4 - Explain how to find the range of a data set. What...Ch. 2.4 - Explain how to find the deviation of an entry in a...Ch. 2.4 - Why is the standard deviation used more frequently...Ch. 2.4 - Explain the relationship between variance and...Ch. 2.4 - Describe the difference between the calculation of...Ch. 2.4 - Given a data set. how do you know whether to...Ch. 2.4 - Discuss the similarities and the differences...Ch. 2.4 - What must you know about a data set before you can...Ch. 2.4 - Finding the Range of a Data Set In Exercises 9 and...Ch. 2.4 - Finding the Range of a Data Set In Exercises 9 and...Ch. 2.4 - Archaeology The depths (in inches) at which 10...Ch. 2.4 - In Exercise 11, compare your answer to part (a)...Ch. 2.4 - Finding Population Statistics In Exercises 13 and...Ch. 2.4 - Finding Population Statistics In Exercises 13 and...Ch. 2.4 - Finding Sample Statistics In Exercises 15 and 16,...Ch. 2.4 - Finding Sample Statistics In Exercises 15 and 16,...Ch. 2.4 - Estimating Standard Deviation Both data sets shown...Ch. 2.4 - Estimating Standard Deviation Both data sets shown...Ch. 2.4 - Salary Offers You are applying for jobs at two...Ch. 2.4 - Prob. 20ECh. 2.4 - Graphical Analysis In Exercises 2124, you are...Ch. 2.4 - Graphical Analysis In Exercises 2124, you are...Ch. 2.4 - Graphical Analysis In Exercises 2124, you are...Ch. 2.4 - Graphical Analysis In Exercises 2124, you are...Ch. 2.4 - Constructing Data Sets In Exercises 2528,...Ch. 2.4 - Constructing Data Sets In Exercises 2528,...Ch. 2.4 - Constructing Data Sets In Exercises 2528,...Ch. 2.4 - Constructing Data Sets In Exercises 2528,...Ch. 2.4 - Using the Empirical Rule In Exercises 2934, use...Ch. 2.4 - Using the Empirical Rule In Exercises 2934, use...Ch. 2.4 - Using the Empirical Rule In Exercises 2934, use...Ch. 2.4 - Using the Empirical Rule In Exercises 2934, use...Ch. 2.4 - Using the Empirical Rule In Exercises 2934, use...Ch. 2.4 - Using the Empirical Rule In Exercises 2934, use...Ch. 2.4 - Using Chebychevs Theorem You are conducting a...Ch. 2.4 - Using Chebychevs Theorem Old Faithful is a famous...Ch. 2.4 - Using Chebychevs Theorem The mean score on a...Ch. 2.4 - Using Chebychevs Theorem The mean number of runs...Ch. 2.4 - Finding the Sample Mean and Standard Deviation for...Ch. 2.4 - Finding the Sample Mean and Standard Deviation for...Ch. 2.4 - Estimating the Sample Mean and Standard Deviation...Ch. 2.4 - Estimating the Sample Mean and Standard Deviation...Ch. 2.4 - Estimating the Sample Mean and Standard Deviation...Ch. 2.4 - Estimating the Sample Mean and Standard Deviation...Ch. 2.4 - Comparing Variation in Different Data Sets In...Ch. 2.4 - Comparing Variation in Different Data Sets In...Ch. 2.4 - Comparing Variation in Different Data Sets In...Ch. 2.4 - Comparing Variation in Different Data Sets In...Ch. 2.4 - Comparing Variation in Different Data Sets In...Ch. 2.4 - Comparing Variation in Different Data Sets In...Ch. 2.4 - Alternative Formula You used SSx=(xx)2 when...Ch. 2.4 - Mean Absolute Deviation Another useful measure of...Ch. 2.4 - Scaling Data Sample annual salaries (in thousands...Ch. 2.4 - Shifting Data Sample annual salaries (in thousands...Ch. 2.4 - Pearsons Index of Skewness The English...Ch. 2.4 - Prob. 56ECh. 2.4 - Specify the lower limit to be 10 and the upper...Ch. 2.4 - Specify the lower limit to be 30 and the upper...Ch. 2.4 - Employees Which state has the greatest number of...Ch. 2.4 - Mean Business Size Estimate the mean number of...Ch. 2.4 - Employees Which state has the greatest number of...Ch. 2.4 - Standard Deviation Estimate the standard deviation...Ch. 2.4 - Standard Deviation Which state has the greatest...Ch. 2.4 - Distribution Describe the distribution of the...Ch. 2.5 - Find the first, second, and third quartiles for...Ch. 2.5 - The tuition costs (in thousands of dollars) for 25...Ch. 2.5 - Find the interquartile range for the points scored...Ch. 2.5 - Draw a box-and-whisker plot that represents the...Ch. 2.5 - The points scored by the 51 winning teams in the...Ch. 2.5 - For the data set in Try It Yourself 2, find the...Ch. 2.5 - The monthly utility bills in a city have a mean of...Ch. 2.5 - Use the information in Example 8 to compare the...Ch. 2.5 - The length of a guest lecturers talk represents...Ch. 2.5 - A motorcycles fuel efficiency represents the ninth...Ch. 2.5 - A students score on the Fundamentals of...Ch. 2.5 - A students IQ score is in the 91st percentile on...Ch. 2.5 - Explain how to identify outliers using the...Ch. 2.5 - Describe the relationship between quartiles and...Ch. 2.5 - True or False? In Exercises 710, determine whether...Ch. 2.5 - True or False? In Exercises 710, determine whether...Ch. 2.5 - True or False? In Exercises 710, determine whether...Ch. 2.5 - True or False? In Exercises 710, determine whether...Ch. 2.5 - Finding Quartiles, Interquartile Range, and...Ch. 2.5 - Finding Quartiles, Interquartile Range, and...Ch. 2.5 - Graphical Analysis In Exercises 13 and 14, use the...Ch. 2.5 - Graphical Analysis In Exercises 13 and 14, use the...Ch. 2.5 - Drawing a Box-and-Whisker Plot In Exercises 1518,...Ch. 2.5 - Drawing a Box-and-Whisker Plot In Exercises 1518,...Ch. 2.5 - Drawing a Box-and-Whisker Plot In Exercises 1518,...Ch. 2.5 - Drawing a Box-and-Whisker Plot In Exercises 1518,...Ch. 2.5 - Graphical Analysis In Exercises 1922, use the...Ch. 2.5 - Graphical Analysis In Exercises 1922, use the...Ch. 2.5 - Graphical Analysis In Exercises 1922, use the...Ch. 2.5 - Graphical Analysis In Exercises 1922, use the...Ch. 2.5 - Prob. 23ECh. 2.5 - Using Technology to Find Quartiles and Draw Graphs...Ch. 2.5 - Using Technology to Find Quartiles and Draw Graphs...Ch. 2.5 - Using Technology to Find Quartiles and Draw Graphs...Ch. 2.5 - Studying Refer to the data set in Exercise 23 and...Ch. 2.5 - Hourly Earnings Refer to the data set in Exercise...Ch. 2.5 - Interpreting Percentiles In Exercises 2932, use...Ch. 2.5 - Interpreting Percentiles In Exercises 2932, use...Ch. 2.5 - Interpreting Percentiles In Exercises 2932, use...Ch. 2.5 - Interpreting Percentiles In Exercises 2932, use...Ch. 2.5 - Finding a Percentile In Exercises 3336, use the...Ch. 2.5 - Finding a Percentile In Exercises 3336, use the...Ch. 2.5 - Finding a Percentile In Exercises 3336, use the...Ch. 2.5 - Finding a Percentile In Exercises 3336, use the...Ch. 2.5 - Finding and Interpreting Percentiles In Exercises...Ch. 2.5 - Finding and Interpreting Percentiles In Exercises...Ch. 2.5 - Finding and Interpreting Percentiles In Exercises...Ch. 2.5 - Which wait times are between the 25th and 75th...Ch. 2.5 - Graphical Analysis In Exercises 41 and 42, the...Ch. 2.5 - Graphical Analysis In Exercises 41 and 42, the...Ch. 2.5 - Finding z-Scores The distribution of the ages of...Ch. 2.5 - Finding z-Scores The distribution of the ages of...Ch. 2.5 - Finding z-Scores The distribution of the ages of...Ch. 2.5 - Finding z-Scores The distribution of the ages of...Ch. 2.5 - Finding z-Scores The distribution of the ages of...Ch. 2.5 - Prob. 48ECh. 2.5 - Life Spans of Tires A brand of automobile tire has...Ch. 2.5 - Life Spans of Fruit Flies The life spans of a...Ch. 2.5 - Comparing z-Scores from Different Data Sets The...Ch. 2.5 - Comparing z-Scores from Different Data Sets The...Ch. 2.5 - Comparing z-Scores from Different Data Sets The...Ch. 2.5 - Comparing z-Scores from Different Data Sets The...Ch. 2.5 - Prob. 55ECh. 2.5 - Prob. 56ECh. 2.5 - Song Lengths Side-by-side box-and-whisker plots...Ch. 2.5 - Credit Card Purchases The credit card purchases...Ch. 2.5 - Modified Box-and-Whisker Plot In Exercises 5962,...Ch. 2.5 - Modified Box-and-Whisker Plot In Exercises 5962,...Ch. 2.5 - Modified Box-and-Whisker Plot In Exercises 5962,...Ch. 2.5 - Modified Box-and-Whisker Plot In Exercises 5962,...Ch. 2 - In Exercises 1 and 2, use the data set, which...Ch. 2 - In Exercises 1 and 2, use the data set, which...Ch. 2 - In Exercises 3 and 4, use the data set shown in...Ch. 2 - In Exercises 3 and 4, use the data set shown in...Ch. 2 - In Exercises 5 and 6, use the data set, which...Ch. 2 - In Exercises 5 and 6, use the data set, which...Ch. 2 - In Exercises 7 and 8, use the data set, which...Ch. 2 - In Exercises 7 and 8, use the data set, which...Ch. 2 - In Exercises 9 and 10, use the data set, which...Ch. 2 - In Exercises 9 and 10, use the data set, which...Ch. 2 - The heights (in feet) and the numbers of stories...Ch. 2 - The U.S. real unemployment rates over a 12-year...Ch. 2 - In Exercises 13 and 14, find the mean, the median,...Ch. 2 - In Exercises 13 and 14, find the mean, the median,...Ch. 2 - For the six test scores 78, 72, 86, 91, 87, and...Ch. 2 - For the four test scores 96, 85, 91, and 86, the...Ch. 2 - Estimate the mean of the frequency distribution...Ch. 2 - The frequency distribution shows the numbers of...Ch. 2 - Describe the shape of the distribution for the...Ch. 2 - Describe the shape of the distribution for the...Ch. 2 - In Exercises 21 and 22, determine whether the...Ch. 2 - In Exercises 21 and 22, determine whether the...Ch. 2 - For the histogram in Exercise 21, which is...Ch. 2 - Prob. 2.3.24RECh. 2 - In Exercises 25 and 26, find the range, mean,...Ch. 2 - In Exercises 25 and 26, find the range, mean,...Ch. 2 - In Exercises 27 and 28, find the range, mean,...Ch. 2 - In Exercises 27 and 28, find the range, mean,...Ch. 2 - The mean charge for electricity for a sample of...Ch. 2 - The mean charge for satellite television for a...Ch. 2 - The mean sale per customer for 40 customers at a...Ch. 2 - The mean duration of the 135 space shuttle flights...Ch. 2 - From a random sample of households, the numbers of...Ch. 2 - From a random sample of airplanes, the numbers of...Ch. 2 - In Exercises 35 and 36, find the coefficient of...Ch. 2 - In Exercises 35 and 36, find the coefficient of...Ch. 2 - In Exercises 3740, use the data set, which...Ch. 2 - In Exercises 3740, use the data set, which...Ch. 2 - In Exercises 3740, use the data set, which...Ch. 2 - In Exercises 3740, use the data set, which...Ch. 2 - Find the interquartile range of the data set from...Ch. 2 - The weights (in pounds) of the defensive players...Ch. 2 - A students test grade of 75 represents the 65th...Ch. 2 - As of December 2016, there were 721 adult...Ch. 2 - The towing capacities (in pounds) of all the...Ch. 2 - The towing capacities (in pounds) of all the...Ch. 2 - The towing capacities (in pounds) of all the...Ch. 2 - The towing capacities (in pounds) of all the...Ch. 2 - The data set represents the numbers of minutes a...Ch. 2 - Use frequency distribution formulas to approximate...Ch. 2 - Prob. 3CQCh. 2 - Prob. 4CQCh. 2 - The mean price of new homes from a sample of...Ch. 2 - Prob. 6CQCh. 2 - Prob. 7CQCh. 2 - The overall averages of 12 students in a...Ch. 2 - The data set represents the numbers of movies that...Ch. 2 - Use frequency distribution formulas to estimate...Ch. 2 - For the data set in Exercise 2, find the...Ch. 2 - The table lists the numbers of albums by The...Ch. 2 - The numbers of minutes it took 12 students in a...Ch. 2 - The data set represents the ages of 15 college...Ch. 2 - The mean gestational length of a sample of 208...Ch. 2 - How Would You Do It? (a) How would you investigate...Ch. 2 - Displaying the Data (a) What type of graph would...Ch. 2 - Measuring the Data (a) What other statistical...Ch. 2 - In Exercises 15, use technology. If possible,...Ch. 2 - In Exercises 15, use technology. If possible,...Ch. 2 - In Exercises 15, use technology. If possible,...Ch. 2 - In Exercises 15, use technology. If possible,...Ch. 2 - In Exercises 15, use technology. If possible,...Ch. 2 - What percent of the distribution lies within one...Ch. 2 - Do the results of Exercise 6 agree with the...Ch. 2 - Do the results of Exercise 6 agree with Chebychevs...Ch. 2 - Use the frequency distribution in Exercise 4 to...Ch. 2 - Prob. 10TCh. 2 - In Exercices 1 and 2, identify the sampling...Ch. 2 - Prob. 2CRCh. 2 - Prob. 3CRCh. 2 - In Exercises 4 and 5, determine whether the number...Ch. 2 - In Exercises 4 and 5, determine whether the number...Ch. 2 - Prob. 6CRCh. 2 - In Exercises 7 and 8, identify the population and...Ch. 2 - Prob. 8CRCh. 2 - In Exercises 9 and 10, determine whether the study...Ch. 2 - Section 1.3 In Exercises 9 and 10, determine...Ch. 2 - Prob. 11CRCh. 2 - Section 1.2 In Exercises 11 and 12, determine...Ch. 2 - The numbers of tornadoes by state in 2016 are...Ch. 2 - Prob. 14CRCh. 2 - Tail lengths (in feet) for a sample of American...Ch. 2 - A study shows that life expectancies for Americans...Ch. 2 - In Exercises 1719, use the data set, which...Ch. 2 - In Exercises 1719, use the data set, which...Ch. 2 - In Exercises 1719, use the data set, which...
Knowledge Booster


Learn more about
Need a deep-dive on the concept behind this application? Look no further. Learn more about this topic, statistics and related others by exploring similar questions and additional content below.Similar questions
- to complete the Case × T Civil Service Numerical Test Sec x T Casework Skills Practice Test + Vaseline euauthoring.panpowered.com/DeliveryWeb/Civil Service Main/84589a48-b934-4b6e-a6e1-a5d75f559df9?transferToken=MxNewOS NGFSPSZSMOMzuz The table below shows the best price available for various items from 4 uniform suppliers. The prices do not include VAT (charged at 20%). Item A1-Uniforms (£)Best Trade (£)Clothing Tech (£)Dress Right (£) Waterproof boots 59.99 39.99 59.99 49.99 Trousers 9.89 9.98 9.99 11.99 Shirts 14.99 15.99 16.99 12.99 Hi-Vis vest 4.49 4.50 4.00 4.00 20.00 25.00 19.50 19.99 Hard hats A company needs to buy a set of 12 uniforms which includes 1 of each item. If the special offers are included, which supplier is cheapest? O O O O A1-Uniforms Best Trade Clothing Tech Dress Right Q Search ENG L UK +0 F6 四吧 6 78 ㄓ F10 9% * CO 1 F12 34 Oarrow_forwardCritics review films out of 5 based on three attributes: the story, the special effects and the acting. The ratings of four critics for a film are collected in the table below.CriticSpecialStory rating Effects rating Acting rating Critic 14.44.34.5Critic 24.14.23.9Critic 33.943.4Critic 44.24.14.2Critic 1 also gave the film a rating for the Director's ability. If the average of Critic 1's ratings was 4.3 what rating did they give to the Director's ability?3.94.04.14.24.3arrow_forwardTwo measurements are made of some quantity. For the first measurement, the average is 74.4528, the RMS error is 6.7441, and the uncertainty of the mean is 0.9264. For the second one, the average is 76.8415, the standard deviation is 8.3348, and the uncertainty of the mean is 1.1448. The expected value is exactly 75. 13. Express the first measurement in public notation. 14. Is there a significant difference between the two measurements? 1 15. How does the first measurement compare with the expected value? 16. How does the second measurement compare with the expected value?arrow_forward
- A hat contains slips of paper numbered 1 through 6. You draw two slips of paper at random from the hat,without replacing the first slip into the hat.(a) (5 points) Write out the sample space S for this experiment.(b) (5 points) Express the event E : {the sum of the numbers on the slips of paper is 4} as a subset of S.(c) (5 points) Find P(E)(d) (5 points) Let F = {the larger minus the smaller number is 0}. What is P(F )?(e) (5 points) Are E and F disjoint? Why or why not?(f) (5 points) Find P(E ∪ F )arrow_forwardIn addition to the in-school milk supplement program, the nurse would like to increase the use of daily vitamin supplements for the children by visiting homes and educating about the merits of vitamins. She believes that currently, about 50% of families with school-age children give the children a daily megavitamin. She would like to increase this to 70%. She plans a two-group study, where one group serves as a control and the other group receives her visits. How many families should she expect to visit to have 80% power of detecting this difference? Assume that drop-out rate is 5%.arrow_forwardA recent survey of 400 americans asked whether or not parents do too much for their young adult children. The results of the survey are shown in the data file. a) Construct the frequency and relative frequency distributions. How many respondents felt that parents do too much for their adult children? What proportion of respondents felt that parents do too little for their adult children? b) Construct a pie chart. Summarize the findingsarrow_forward
- The average number of minutes Americans commute to work is 27.7 minutes (Sterling's Best Places, April 13, 2012). The average commute time in minutes for 48 cities are as follows: Click on the datafile logo to reference the data. DATA file Albuquerque 23.3 Jacksonville 26.2 Phoenix 28.3 Atlanta 28.3 Kansas City 23.4 Pittsburgh 25.0 Austin 24.6 Las Vegas 28.4 Portland 26.4 Baltimore 32.1 Little Rock 20.1 Providence 23.6 Boston 31.7 Los Angeles 32.2 Richmond 23.4 Charlotte 25.8 Louisville 21.4 Sacramento 25.8 Chicago 38.1 Memphis 23.8 Salt Lake City 20.2 Cincinnati 24.9 Miami 30.7 San Antonio 26.1 Cleveland 26.8 Milwaukee 24.8 San Diego 24.8 Columbus 23.4 Minneapolis 23.6 San Francisco 32.6 Dallas 28.5 Nashville 25.3 San Jose 28.5 Denver 28.1 New Orleans 31.7 Seattle 27.3 Detroit 29.3 New York 43.8 St. Louis 26.8 El Paso 24.4 Oklahoma City 22.0 Tucson 24.0 Fresno 23.0 Orlando 27.1 Tulsa 20.1 Indianapolis 24.8 Philadelphia 34.2 Washington, D.C. 32.8 a. What is the mean commute time for…arrow_forwardMorningstar tracks the total return for a large number of mutual funds. The following table shows the total return and the number of funds for four categories of mutual funds. Click on the datafile logo to reference the data. DATA file Type of Fund Domestic Equity Number of Funds Total Return (%) 9191 4.65 International Equity 2621 18.15 Hybrid 1419 2900 11.36 6.75 Specialty Stock a. Using the number of funds as weights, compute the weighted average total return for these mutual funds. (to 2 decimals) % b. Is there any difficulty associated with using the "number of funds" as the weights in computing the weighted average total return in part (a)? Discuss. What else might be used for weights? The input in the box below will not be graded, but may be reviewed and considered by your instructor. c. Suppose you invested $10,000 in this group of mutual funds and diversified the investment by placing $2000 in Domestic Equity funds, $4000 in International Equity funds, $3000 in Specialty Stock…arrow_forwardThe days to maturity for a sample of five money market funds are shown here. The dollar amounts invested in the funds are provided. Days to Maturity 20 Dollar Value ($ millions) 20 12 30 7 10 5 6 15 10 Use the weighted mean to determine the mean number of days to maturity for dollars invested in these five money market funds (to 1 decimal). daysarrow_forward
- c. What are the first and third quartiles? First Quartiles (to 1 decimals) Third Quartiles (to 4 decimals) × ☑ Which companies spend the most money on advertising? Business Insider maintains a list of the top-spending companies. In 2014, Procter & Gamble spent more than any other company, a whopping $5 billion. In second place was Comcast, which spent $3.08 billion (Business Insider website, December 2014). The top 12 companies and the amount each spent on advertising in billions of dollars are as follows. Click on the datafile logo to reference the data. DATA file Company Procter & Gamble Comcast Advertising ($billions) $5.00 3.08 2.91 Company American Express General Motors Advertising ($billions) $2.19 2.15 ETET AT&T Ford Verizon L'Oreal 2.56 2.44 2.34 Toyota Fiat Chrysler Walt Disney Company J.P Morgan a. What is the mean amount spent on advertising? (to 2 decimals) 2.55 b. What is the median amount spent on advertising? (to 3 decimals) 2.09 1.97 1.96 1.88arrow_forwardMartinez Auto Supplies has retail stores located in eight cities in California. The price they charge for a particular product in each city are vary because of differing competitive conditions. For instance, the price they charge for a case of a popular brand of motor oil in each city follows. Also shown are the number of cases that Martinez Auto sold last quarter in each city. City Price ($) Sales (cases) Bakersfield 34.99 501 Los Angeles 38.99 1425 Modesto 36.00 294 Oakland 33.59 882 Sacramento 40.99 715 San Diego 38.59 1088 San Francisco 39.59 1644 San Jose 37.99 819 Compute the average sales price per case for this product during the last quarter? Round your answer to two decimal places.arrow_forwardConsider the following data and corresponding weights. xi Weight(wi) 3.2 6 2.0 3 2.5 2 5.0 8 a. Compute the weighted mean (to 2 decimals). b. Compute the sample mean of the four data values without weighting. Note the difference in the results provided by the two computations (to 3 decimals).arrow_forward
arrow_back_ios
SEE MORE QUESTIONS
arrow_forward_ios
Recommended textbooks for you
 Glencoe Algebra 1, Student Edition, 9780079039897...AlgebraISBN:9780079039897Author:CarterPublisher:McGraw Hill
 Big Ideas Math A Bridge To Success Algebra 1: Stu...AlgebraISBN:9781680331141Author:HOUGHTON MIFFLIN HARCOURTPublisher:Houghton Mifflin Harcourt
 Holt Mcdougal Larson Pre-algebra: Student Edition...AlgebraISBN:9780547587776Author:HOLT MCDOUGALPublisher:HOLT MCDOUGAL
Glencoe Algebra 1, Student Edition, 9780079039897...
Algebra
ISBN:9780079039897
Author:Carter
Publisher:McGraw Hill
Big Ideas Math A Bridge To Success Algebra 1: Stu...
Algebra
ISBN:9781680331141
Author:HOUGHTON MIFFLIN HARCOURT
Publisher:Houghton Mifflin Harcourt
Holt Mcdougal Larson Pre-algebra: Student Edition...
Algebra
ISBN:9780547587776
Author:HOLT MCDOUGAL
Publisher:HOLT MCDOUGAL
what is Research Design, Research Design Types, and Research Design Methods; Author: Educational Hub;https://www.youtube.com/watch?v=LpmGSioXxdo;License: Standard YouTube License, CC-BY