
Elementary Statistics: Picturing the World (7th Edition)
7th Edition
ISBN: 9780134683416
Author: Ron Larson, Betsy Farber
Publisher: PEARSON
expand_more
expand_more
format_list_bulleted
Concept explainers
Videos
Textbook Question
Chapter 2.2, Problem 32E
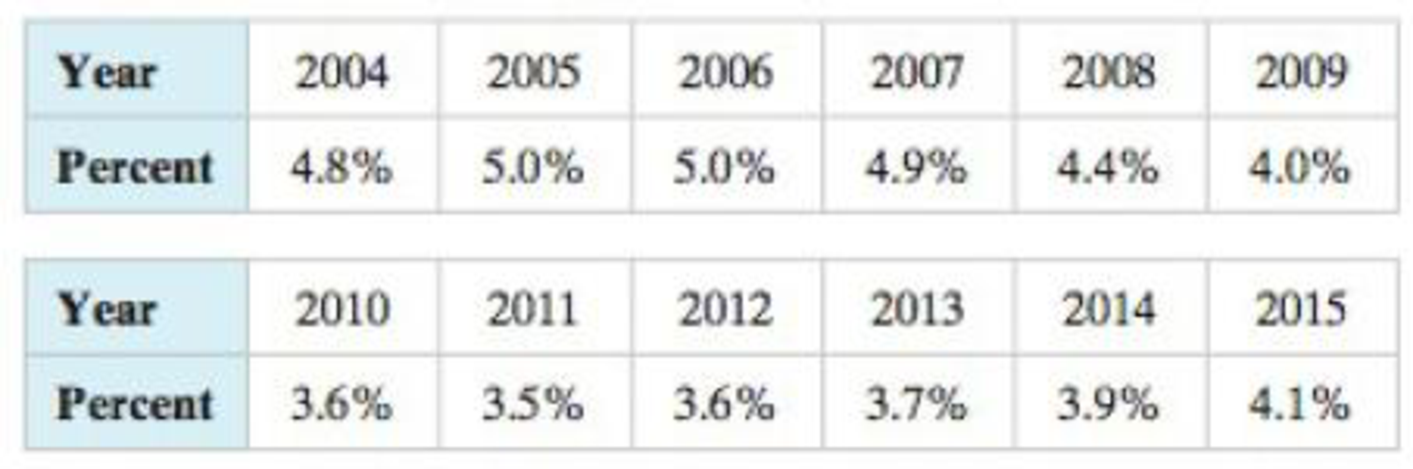
Construction Use a time series chart to display the data shown in the table. The data represent the percentages of the U.S. gross domestic product (GDP) that come from the construction sector. (Source: U.S. Bureau of Economic Analysis)
Expert Solution & Answer
Want to see the full answer?
Check out a sample textbook solution
Students have asked these similar questions
The accompanying data shows the fossil fuels production, fossil fuels consumption, and total energy consumption in quadrillions of BTUs of a certain region for the years 1986 to 2015. Complete parts a and b.
Develop line charts for each variable and identify the characteristics of the time series (that is, random, stationary, trend, seasonal, or cyclical).
What is the line chart for the variable Fossil Fuels Production?
The accompanying data shows the fossil fuels production, fossil fuels consumption, and total energy consumption in quadrillions of BTUs of a certain region for the years 1986 to 2015. Complete parts a and b.
Year Fossil Fuels Production Fossil Fuels Consumption Total Energy Consumption1949 28.748 29.002 31.9821950 32.563 31.632 34.6161951 35.792 34.008 36.9741952 34.977 33.800 36.7481953 35.349 34.826 37.6641954 33.764 33.877 36.6391955 37.364 37.410 40.2081956 39.771 38.888 41.7541957 40.133 38.926 41.7871958 37.216 38.717 41.6451959 39.045 40.550 43.4661960 39.869 42.137 45.0861961 40.307 42.758 45.7381962 41.732 44.681 47.8261963 44.037 46.509 49.6441964 45.789 48.543 51.8151965 47.235 50.577 54.0151966 50.035 53.514 57.0141967 52.597 55.127 58.9051968 54.306 58.502 62.4151969 56.286…
For each of the time series, construct a line chart of the data and identify the characteristics of the time series (that is, random, stationary, trend, seasonal, or cyclical).
Month PercentApr 1972 4.97May 1972 5.00Jun 1972 5.04Jul 1972 5.25Aug 1972 5.27Sep 1972 5.50Oct 1972 5.73Nov 1972 5.75Dec 1972 5.79Jan 1973 6.00Feb 1973 6.02Mar 1973 6.30Apr 1973 6.61May 1973 7.01Jun 1973 7.49Jul 1973 8.30Aug 1973 9.23Sep 1973 9.86Oct 1973 9.94Nov 1973 9.75Dec 1973 9.75Jan 1974 9.73Feb 1974 9.21Mar 1974 8.85Apr 1974 10.02May 1974 11.25Jun 1974 11.54Jul 1974 11.97Aug 1974 12.00Sep 1974 12.00Oct 1974 11.68Nov 1974 10.83Dec 1974 10.50Jan 1975 10.05Feb 1975 8.96Mar 1975 7.93Apr 1975 7.50May 1975 7.40Jun 1975 7.07Jul 1975 7.15Aug 1975 7.66Sep 1975 7.88Oct 1975 7.96Nov 1975 7.53Dec 1975 7.26Jan 1976 7.00Feb 1976 6.75Mar 1976 6.75Apr 1976 6.75May 1976…
Chapter 2 Solutions
Elementary Statistics: Picturing the World (7th Edition)
Ch. 2.1 - Construct a frequency distribution using the...Ch. 2.1 - Using the frequency distribution constructed in...Ch. 2.1 - Use the frequency distribution from Try It...Ch. 2.1 - Use the frequency distribution from Try It...Ch. 2.1 - Use the frequency distribution in Try It Yourself...Ch. 2.1 - Use the frequency distribution from Try It...Ch. 2.1 - Use technology and the frequency distribution from...Ch. 2.1 - What are some benefits of representing data sets...Ch. 2.1 - Why should the number of classes in a frequency...Ch. 2.1 - What is the difference between class limits and...
Ch. 2.1 - What is the difference between relative frequency...Ch. 2.1 - After constructing an expanded frequency...Ch. 2.1 - What is the difference between a frequency polygon...Ch. 2.1 - True or False? In Exercises 710, determine whether...Ch. 2.1 - True or False? In Exercises 710, determine whether...Ch. 2.1 - True or False? In Exercises 710, determine whether...Ch. 2.1 - Prob. 10ECh. 2.1 - In Exercises 1114, use the minimum and maximum...Ch. 2.1 - In Exercises 1114, use the minimum and maximum...Ch. 2.1 - In Exercises 1114, use the minimum and maximum...Ch. 2.1 - In Exercises 1114, use the minimum and maximum...Ch. 2.1 - Reading a Frequency Distribution In Exercises 15...Ch. 2.1 - Reading a Frequency Distribution In Exercises 15...Ch. 2.1 - Use the frequency distribution in Exercise 15 to...Ch. 2.1 - Use the frequency distribution in Exercise 16 to...Ch. 2.1 - Graphical Analysis In Exercises 19 and 20, use the...Ch. 2.1 - Graphical Analysis In Exercises 19 and 20, use the...Ch. 2.1 - Graphical Analysis In Exercises 21 and 22, use the...Ch. 2.1 - Graphical Analysis In Exercises 21 and 22, use the...Ch. 2.1 - Graphical Analysis In Exercises 23 and 24, use the...Ch. 2.1 - Graphical Analysis In Exercises 23 and 24, use the...Ch. 2.1 - Prob. 25ECh. 2.1 - Graphical Analysis In Exercises 25 and 26, use the...Ch. 2.1 - Use the ogive in Exercise 25 to approximate (a)...Ch. 2.1 - Use the ogive in Exercise 26 to approximate (a)...Ch. 2.1 - Constructing a Frequency Distribution In Exercises...Ch. 2.1 - Constructing a Frequency Distribution In Exercises...Ch. 2.1 - Constructing a Frequency Distribution and a...Ch. 2.1 - Constructing a Frequency Distribution and a...Ch. 2.1 - Constructing a Frequency Distribution and a...Ch. 2.1 - Constructing a Frequency Distribution and a...Ch. 2.1 - Constructing a Frequency Distribution and a...Ch. 2.1 - Constructing a Frequency Distribution and a...Ch. 2.1 - Constructing a Frequency Distribution and a...Ch. 2.1 - Constructing a Frequency Distribution and a...Ch. 2.1 - Constructing a Frequency Distribution and a...Ch. 2.1 - Constructing a Frequency Distribution and a...Ch. 2.1 - Constructing a Cumulative Frequency Distribution...Ch. 2.1 - Constructing a Cumulative Frequency Distribution...Ch. 2.1 - In Exercises 43 and 44, use the data set and the...Ch. 2.1 - In Exercises 43 and 44, use the data set and the...Ch. 2.1 - What Would You Do? You work at a bank and are...Ch. 2.1 - What Would You Do? The admissions department for a...Ch. 2.1 - Writing Use the data set listed and technology to...Ch. 2.2 - Use a stem-and-leaf plot to organize the points...Ch. 2.2 - Using two rows for each stem, revise the...Ch. 2.2 - Use a dot plot to organize the points scored by...Ch. 2.2 - The numbers of earned degrees conferred (in...Ch. 2.2 - Every year, the Better Business Bureau (BBB)...Ch. 2.2 - The lengths of employment and the salaries of 10...Ch. 2.2 - Use the table in Example 7 to construct a time...Ch. 2.2 - Name some ways to display quantitative data...Ch. 2.2 - What is an advantage of using a stem-and-leaf plot...Ch. 2.2 - In terms of displaying data, how is a...Ch. 2.2 - How is a Pareto chart different from a standard...Ch. 2.2 - Putting Graphs in Context In Exercises 58, match...Ch. 2.2 - Putting Graphs in Context In Exercises 58, match...Ch. 2.2 - Putting Graphs in Context In Exercises 58, match...Ch. 2.2 - Putting Graphs in Context In Exercises 58, match...Ch. 2.2 - Graphical Analysis In Exercises 912, use the...Ch. 2.2 - Graphical Analysis In Exercises 912, use the...Ch. 2.2 - Graphical Analysis In Exercises 912, use the...Ch. 2.2 - Prob. 12ECh. 2.2 - Graphical Analysis In Exercises 1316, give three...Ch. 2.2 - Graphical Analysis In Exercises 1316, give three...Ch. 2.2 - Graphical Analysis In Exercises 1316, give three...Ch. 2.2 - Graphical Analysis In Exercises 1316, give three...Ch. 2.2 - Graphing Data Sets In Exercises 1732, organize the...Ch. 2.2 - Graphing Data Sets In Exercises 1732, organize the...Ch. 2.2 - Prob. 19ECh. 2.2 - Graphing Data Sets In Exercises 1732, organize the...Ch. 2.2 - Graphing Data Sets In Exercises 1732, organize the...Ch. 2.2 - Graphing Data Sets In Exercises 1732, organize the...Ch. 2.2 - Graphing Data Sets In Exercises 1732, organize the...Ch. 2.2 - Graphing Data Sets In Exercises 1732, organize the...Ch. 2.2 - Graphing Data Sets In Exercises 1732, organize the...Ch. 2.2 - Graphing Data Sets In Exercises 1732, organize the...Ch. 2.2 - Graphing Data Sets In Exercises 1732, organize the...Ch. 2.2 - Graphing Data Sets In Exercises 1732, organize the...Ch. 2.2 - Hourly Wages Use a scatter plot to display the...Ch. 2.2 - Salaries Use a scatter plot to display the data...Ch. 2.2 - Engineering Degrees Use a time series chart to...Ch. 2.2 - Construction Use a time series chart to display...Ch. 2.2 - Basketball Display the data below in a...Ch. 2.2 - Phone Screen Sizes Display the data below in a dot...Ch. 2.2 - Favorite Season Display the data below in a Pareto...Ch. 2.2 - Favorite Day of the Week Display the data below in...Ch. 2.2 - A Misleading Graph? A misleading graph is not...Ch. 2.2 - Prob. 38ECh. 2.2 - A Misleading Graph? A misleading graph is not...Ch. 2.2 - Prob. 40ECh. 2.2 - Law Firm Salaries A back-to-back stem-and-leaf...Ch. 2.2 - Yoga Classes The data sets at the left show the...Ch. 2.2 - Choosing an Appropriate Display Use technology to...Ch. 2.3 - Find the mean of the points scored by the 51...Ch. 2.3 - Find the median of the points scored by the 51...Ch. 2.3 - The points scored by the winning teams in the...Ch. 2.3 - Find the mode of the points scored by the 51...Ch. 2.3 - In a survey, 1534 adults were asked, How much do...Ch. 2.3 - Remove the data entry 65 from the data set in...Ch. 2.3 - In Example 7, your grade in the two-credit course...Ch. 2.3 - Use a frequency distribution to estimate the mean...Ch. 2.3 - True or False? In Exercises 14, determine whether...Ch. 2.3 - True or False? In Exercises 14, determine whether...Ch. 2.3 - True or False? In Exercises 14, determine whether...Ch. 2.3 - True or False? In Exercises 14, determine whether...Ch. 2.3 - Constructing Data Sets In Exercises 58, construct...Ch. 2.3 - Constructing Data Sets In Exercises 58, construct...Ch. 2.3 - Mean is not representative of a typical number in...Ch. 2.3 - Prob. 8ECh. 2.3 - Graphical Analysis In Exercises 912, determine...Ch. 2.3 - Graphical Analysis In Exercises 912, determine...Ch. 2.3 - Graphical Analysis In Exercises 912, determine...Ch. 2.3 - Graphical Analysis In Exercises 912, determine...Ch. 2.3 - Graphical Analysis In Exercises 912, determine...Ch. 2.3 - Graphical Analysis In Exercises 912, determine...Ch. 2.3 - Graphical Analysis In Exercises 912, determine...Ch. 2.3 - Graphical Analysis In Exercises 912, determine...Ch. 2.3 - Finding and Discussing the Mean, Median, and Mode...Ch. 2.3 - Finding and Discussing the Mean, Median, and Mode...Ch. 2.3 - Finding and Discussing the Mean, Median, and Mode...Ch. 2.3 - Finding and Discussing the Mean, Median, and Mode...Ch. 2.3 - Finding and Discussing the Mean, Median, and Mode...Ch. 2.3 - Finding and Discussing the Mean, Median, and Mode...Ch. 2.3 - Finding and Discussing the Mean, Median, and Mode...Ch. 2.3 - Finding and Discussing the Mean, Median, and Mode...Ch. 2.3 - Prob. 25ECh. 2.3 - Finding and Discussing the Mean, Median, and Mode...Ch. 2.3 - Finding and Discussing the Mean, Median, and Mode...Ch. 2.3 - Prob. 28ECh. 2.3 - Finding and Discussing the Mean, Median, and Mode...Ch. 2.3 - Finding and Discussing the Mean, Median, and Mode...Ch. 2.3 - Finding and Discussing the Mean, Median, and Mode...Ch. 2.3 - Finding and Discussing the Mean, Median, and Mode...Ch. 2.3 - Finding and Discussing the Mean, Median, and Mode...Ch. 2.3 - Finding and Discussing the Mean, Median, and Mode...Ch. 2.3 - Graphical Analysis In Exercises 35 and 36,...Ch. 2.3 - Graphical Analysis In Exercises 35 and 36,...Ch. 2.3 - In Exercises 3740, without performing any...Ch. 2.3 - In Exercises 3740, without performing any...Ch. 2.3 - In Exercises 3740, without performing any...Ch. 2.3 - In Exercises 3740, without performing any...Ch. 2.3 - Finding a Weighted Mean In Exercises 4146, find...Ch. 2.3 - Finding a Weighted Mean In Exercises 4146, find...Ch. 2.3 - Finding a Weighted Mean In Exercises 4146, find...Ch. 2.3 - Finding a Weighted Mean In Exercises 4146, find...Ch. 2.3 - Finding a Weighted Mean In Exercises 4146, find...Ch. 2.3 - Finding a Weighted Mean In Exercises 4146, find...Ch. 2.3 - Finding a Weighted Mean In Exercises 4146, find...Ch. 2.3 - Finding a Weighted Mean In Exercises 4146, find...Ch. 2.3 - Finding the Mean of a Frequency Distribution In...Ch. 2.3 - Finding the Mean of a Frequency Distribution In...Ch. 2.3 - Finding the Mean of a Frequency Distribution In...Ch. 2.3 - Finding the Mean of a Frequency Distribution In...Ch. 2.3 - Identifying the Shape of a Distribution In...Ch. 2.3 - Identifying the Shape of a Distribution In...Ch. 2.3 - Identifying the Shape of a Distribution In...Ch. 2.3 - Identifying the Shape of a Distribution In...Ch. 2.3 - Protein Powder During a quality assurance check,...Ch. 2.3 - U.S. Trade Deficits The table at the left shows...Ch. 2.3 - Graphical Analysis In Exercises 59 and 60, the...Ch. 2.3 - Graphical Analysis In Exercises 59 and 60, the...Ch. 2.3 - Prob. 61ECh. 2.3 - Prob. 62ECh. 2.3 - Prob. 63ECh. 2.3 - Prob. 64ECh. 2.3 - Data Analysis Students in an experimental...Ch. 2.3 - Trimmed Mean To find the 10% trimmed mean of a...Ch. 2.3 - Specify the lower limit to be 1 and the upper...Ch. 2.3 - Specify the lower limit to be 0 and the upper...Ch. 2.4 - Find the range of the starting salaries for...Ch. 2.4 - Find the population variance and standard...Ch. 2.4 - Refer to the study in Example 3. The recovery...Ch. 2.4 - Sample office rental rates (in dollars per square...Ch. 2.4 - Write a data set that has 10 entries, a mean of...Ch. 2.4 - Estimate the percent of women ages 2029 whose...Ch. 2.4 - Apply Chebychevs Theorem to the data for Iowa...Ch. 2.4 - Change three of the 6s in the data set to 4s. How...Ch. 2.4 - In the frequency distribution in Example 9, 599.5...Ch. 2.4 - Find the coefficient of variation for the office...Ch. 2.4 - Explain how to find the range of a data set. What...Ch. 2.4 - Explain how to find the deviation of an entry in a...Ch. 2.4 - Why is the standard deviation used more frequently...Ch. 2.4 - Explain the relationship between variance and...Ch. 2.4 - Describe the difference between the calculation of...Ch. 2.4 - Given a data set. how do you know whether to...Ch. 2.4 - Discuss the similarities and the differences...Ch. 2.4 - What must you know about a data set before you can...Ch. 2.4 - Finding the Range of a Data Set In Exercises 9 and...Ch. 2.4 - Finding the Range of a Data Set In Exercises 9 and...Ch. 2.4 - Archaeology The depths (in inches) at which 10...Ch. 2.4 - In Exercise 11, compare your answer to part (a)...Ch. 2.4 - Finding Population Statistics In Exercises 13 and...Ch. 2.4 - Finding Population Statistics In Exercises 13 and...Ch. 2.4 - Finding Sample Statistics In Exercises 15 and 16,...Ch. 2.4 - Finding Sample Statistics In Exercises 15 and 16,...Ch. 2.4 - Estimating Standard Deviation Both data sets shown...Ch. 2.4 - Estimating Standard Deviation Both data sets shown...Ch. 2.4 - Salary Offers You are applying for jobs at two...Ch. 2.4 - Prob. 20ECh. 2.4 - Graphical Analysis In Exercises 2124, you are...Ch. 2.4 - Graphical Analysis In Exercises 2124, you are...Ch. 2.4 - Graphical Analysis In Exercises 2124, you are...Ch. 2.4 - Graphical Analysis In Exercises 2124, you are...Ch. 2.4 - Constructing Data Sets In Exercises 2528,...Ch. 2.4 - Constructing Data Sets In Exercises 2528,...Ch. 2.4 - Constructing Data Sets In Exercises 2528,...Ch. 2.4 - Constructing Data Sets In Exercises 2528,...Ch. 2.4 - Using the Empirical Rule In Exercises 2934, use...Ch. 2.4 - Using the Empirical Rule In Exercises 2934, use...Ch. 2.4 - Using the Empirical Rule In Exercises 2934, use...Ch. 2.4 - Using the Empirical Rule In Exercises 2934, use...Ch. 2.4 - Using the Empirical Rule In Exercises 2934, use...Ch. 2.4 - Using the Empirical Rule In Exercises 2934, use...Ch. 2.4 - Using Chebychevs Theorem You are conducting a...Ch. 2.4 - Using Chebychevs Theorem Old Faithful is a famous...Ch. 2.4 - Using Chebychevs Theorem The mean score on a...Ch. 2.4 - Using Chebychevs Theorem The mean number of runs...Ch. 2.4 - Finding the Sample Mean and Standard Deviation for...Ch. 2.4 - Finding the Sample Mean and Standard Deviation for...Ch. 2.4 - Estimating the Sample Mean and Standard Deviation...Ch. 2.4 - Estimating the Sample Mean and Standard Deviation...Ch. 2.4 - Estimating the Sample Mean and Standard Deviation...Ch. 2.4 - Estimating the Sample Mean and Standard Deviation...Ch. 2.4 - Comparing Variation in Different Data Sets In...Ch. 2.4 - Comparing Variation in Different Data Sets In...Ch. 2.4 - Comparing Variation in Different Data Sets In...Ch. 2.4 - Comparing Variation in Different Data Sets In...Ch. 2.4 - Comparing Variation in Different Data Sets In...Ch. 2.4 - Comparing Variation in Different Data Sets In...Ch. 2.4 - Alternative Formula You used SSx=(xx)2 when...Ch. 2.4 - Mean Absolute Deviation Another useful measure of...Ch. 2.4 - Scaling Data Sample annual salaries (in thousands...Ch. 2.4 - Shifting Data Sample annual salaries (in thousands...Ch. 2.4 - Pearsons Index of Skewness The English...Ch. 2.4 - Prob. 56ECh. 2.4 - Specify the lower limit to be 10 and the upper...Ch. 2.4 - Specify the lower limit to be 30 and the upper...Ch. 2.4 - Employees Which state has the greatest number of...Ch. 2.4 - Mean Business Size Estimate the mean number of...Ch. 2.4 - Employees Which state has the greatest number of...Ch. 2.4 - Standard Deviation Estimate the standard deviation...Ch. 2.4 - Standard Deviation Which state has the greatest...Ch. 2.4 - Distribution Describe the distribution of the...Ch. 2.5 - Find the first, second, and third quartiles for...Ch. 2.5 - The tuition costs (in thousands of dollars) for 25...Ch. 2.5 - Find the interquartile range for the points scored...Ch. 2.5 - Draw a box-and-whisker plot that represents the...Ch. 2.5 - The points scored by the 51 winning teams in the...Ch. 2.5 - For the data set in Try It Yourself 2, find the...Ch. 2.5 - The monthly utility bills in a city have a mean of...Ch. 2.5 - Use the information in Example 8 to compare the...Ch. 2.5 - The length of a guest lecturers talk represents...Ch. 2.5 - A motorcycles fuel efficiency represents the ninth...Ch. 2.5 - A students score on the Fundamentals of...Ch. 2.5 - A students IQ score is in the 91st percentile on...Ch. 2.5 - Explain how to identify outliers using the...Ch. 2.5 - Describe the relationship between quartiles and...Ch. 2.5 - True or False? In Exercises 710, determine whether...Ch. 2.5 - True or False? In Exercises 710, determine whether...Ch. 2.5 - True or False? In Exercises 710, determine whether...Ch. 2.5 - True or False? In Exercises 710, determine whether...Ch. 2.5 - Finding Quartiles, Interquartile Range, and...Ch. 2.5 - Finding Quartiles, Interquartile Range, and...Ch. 2.5 - Graphical Analysis In Exercises 13 and 14, use the...Ch. 2.5 - Graphical Analysis In Exercises 13 and 14, use the...Ch. 2.5 - Drawing a Box-and-Whisker Plot In Exercises 1518,...Ch. 2.5 - Drawing a Box-and-Whisker Plot In Exercises 1518,...Ch. 2.5 - Drawing a Box-and-Whisker Plot In Exercises 1518,...Ch. 2.5 - Drawing a Box-and-Whisker Plot In Exercises 1518,...Ch. 2.5 - Graphical Analysis In Exercises 1922, use the...Ch. 2.5 - Graphical Analysis In Exercises 1922, use the...Ch. 2.5 - Graphical Analysis In Exercises 1922, use the...Ch. 2.5 - Graphical Analysis In Exercises 1922, use the...Ch. 2.5 - Prob. 23ECh. 2.5 - Using Technology to Find Quartiles and Draw Graphs...Ch. 2.5 - Using Technology to Find Quartiles and Draw Graphs...Ch. 2.5 - Using Technology to Find Quartiles and Draw Graphs...Ch. 2.5 - Studying Refer to the data set in Exercise 23 and...Ch. 2.5 - Hourly Earnings Refer to the data set in Exercise...Ch. 2.5 - Interpreting Percentiles In Exercises 2932, use...Ch. 2.5 - Interpreting Percentiles In Exercises 2932, use...Ch. 2.5 - Interpreting Percentiles In Exercises 2932, use...Ch. 2.5 - Interpreting Percentiles In Exercises 2932, use...Ch. 2.5 - Finding a Percentile In Exercises 3336, use the...Ch. 2.5 - Finding a Percentile In Exercises 3336, use the...Ch. 2.5 - Finding a Percentile In Exercises 3336, use the...Ch. 2.5 - Finding a Percentile In Exercises 3336, use the...Ch. 2.5 - Finding and Interpreting Percentiles In Exercises...Ch. 2.5 - Finding and Interpreting Percentiles In Exercises...Ch. 2.5 - Finding and Interpreting Percentiles In Exercises...Ch. 2.5 - Which wait times are between the 25th and 75th...Ch. 2.5 - Graphical Analysis In Exercises 41 and 42, the...Ch. 2.5 - Graphical Analysis In Exercises 41 and 42, the...Ch. 2.5 - Finding z-Scores The distribution of the ages of...Ch. 2.5 - Finding z-Scores The distribution of the ages of...Ch. 2.5 - Finding z-Scores The distribution of the ages of...Ch. 2.5 - Finding z-Scores The distribution of the ages of...Ch. 2.5 - Finding z-Scores The distribution of the ages of...Ch. 2.5 - Prob. 48ECh. 2.5 - Life Spans of Tires A brand of automobile tire has...Ch. 2.5 - Life Spans of Fruit Flies The life spans of a...Ch. 2.5 - Comparing z-Scores from Different Data Sets The...Ch. 2.5 - Comparing z-Scores from Different Data Sets The...Ch. 2.5 - Comparing z-Scores from Different Data Sets The...Ch. 2.5 - Comparing z-Scores from Different Data Sets The...Ch. 2.5 - Prob. 55ECh. 2.5 - Prob. 56ECh. 2.5 - Song Lengths Side-by-side box-and-whisker plots...Ch. 2.5 - Credit Card Purchases The credit card purchases...Ch. 2.5 - Modified Box-and-Whisker Plot In Exercises 5962,...Ch. 2.5 - Modified Box-and-Whisker Plot In Exercises 5962,...Ch. 2.5 - Modified Box-and-Whisker Plot In Exercises 5962,...Ch. 2.5 - Modified Box-and-Whisker Plot In Exercises 5962,...Ch. 2 - In Exercises 1 and 2, use the data set, which...Ch. 2 - In Exercises 1 and 2, use the data set, which...Ch. 2 - In Exercises 3 and 4, use the data set shown in...Ch. 2 - In Exercises 3 and 4, use the data set shown in...Ch. 2 - In Exercises 5 and 6, use the data set, which...Ch. 2 - In Exercises 5 and 6, use the data set, which...Ch. 2 - In Exercises 7 and 8, use the data set, which...Ch. 2 - In Exercises 7 and 8, use the data set, which...Ch. 2 - In Exercises 9 and 10, use the data set, which...Ch. 2 - In Exercises 9 and 10, use the data set, which...Ch. 2 - The heights (in feet) and the numbers of stories...Ch. 2 - The U.S. real unemployment rates over a 12-year...Ch. 2 - In Exercises 13 and 14, find the mean, the median,...Ch. 2 - In Exercises 13 and 14, find the mean, the median,...Ch. 2 - For the six test scores 78, 72, 86, 91, 87, and...Ch. 2 - For the four test scores 96, 85, 91, and 86, the...Ch. 2 - Estimate the mean of the frequency distribution...Ch. 2 - The frequency distribution shows the numbers of...Ch. 2 - Describe the shape of the distribution for the...Ch. 2 - Describe the shape of the distribution for the...Ch. 2 - In Exercises 21 and 22, determine whether the...Ch. 2 - In Exercises 21 and 22, determine whether the...Ch. 2 - For the histogram in Exercise 21, which is...Ch. 2 - Prob. 2.3.24RECh. 2 - In Exercises 25 and 26, find the range, mean,...Ch. 2 - In Exercises 25 and 26, find the range, mean,...Ch. 2 - In Exercises 27 and 28, find the range, mean,...Ch. 2 - In Exercises 27 and 28, find the range, mean,...Ch. 2 - The mean charge for electricity for a sample of...Ch. 2 - The mean charge for satellite television for a...Ch. 2 - The mean sale per customer for 40 customers at a...Ch. 2 - The mean duration of the 135 space shuttle flights...Ch. 2 - From a random sample of households, the numbers of...Ch. 2 - From a random sample of airplanes, the numbers of...Ch. 2 - In Exercises 35 and 36, find the coefficient of...Ch. 2 - In Exercises 35 and 36, find the coefficient of...Ch. 2 - In Exercises 3740, use the data set, which...Ch. 2 - In Exercises 3740, use the data set, which...Ch. 2 - In Exercises 3740, use the data set, which...Ch. 2 - In Exercises 3740, use the data set, which...Ch. 2 - Find the interquartile range of the data set from...Ch. 2 - The weights (in pounds) of the defensive players...Ch. 2 - A students test grade of 75 represents the 65th...Ch. 2 - As of December 2016, there were 721 adult...Ch. 2 - The towing capacities (in pounds) of all the...Ch. 2 - The towing capacities (in pounds) of all the...Ch. 2 - The towing capacities (in pounds) of all the...Ch. 2 - The towing capacities (in pounds) of all the...Ch. 2 - The data set represents the numbers of minutes a...Ch. 2 - Use frequency distribution formulas to approximate...Ch. 2 - Prob. 3CQCh. 2 - Prob. 4CQCh. 2 - The mean price of new homes from a sample of...Ch. 2 - Prob. 6CQCh. 2 - Prob. 7CQCh. 2 - The overall averages of 12 students in a...Ch. 2 - The data set represents the numbers of movies that...Ch. 2 - Use frequency distribution formulas to estimate...Ch. 2 - For the data set in Exercise 2, find the...Ch. 2 - The table lists the numbers of albums by The...Ch. 2 - The numbers of minutes it took 12 students in a...Ch. 2 - The data set represents the ages of 15 college...Ch. 2 - The mean gestational length of a sample of 208...Ch. 2 - How Would You Do It? (a) How would you investigate...Ch. 2 - Displaying the Data (a) What type of graph would...Ch. 2 - Measuring the Data (a) What other statistical...Ch. 2 - In Exercises 15, use technology. If possible,...Ch. 2 - In Exercises 15, use technology. If possible,...Ch. 2 - In Exercises 15, use technology. If possible,...Ch. 2 - In Exercises 15, use technology. If possible,...Ch. 2 - In Exercises 15, use technology. If possible,...Ch. 2 - What percent of the distribution lies within one...Ch. 2 - Do the results of Exercise 6 agree with the...Ch. 2 - Do the results of Exercise 6 agree with Chebychevs...Ch. 2 - Use the frequency distribution in Exercise 4 to...Ch. 2 - Prob. 10TCh. 2 - In Exercices 1 and 2, identify the sampling...Ch. 2 - Prob. 2CRCh. 2 - Prob. 3CRCh. 2 - In Exercises 4 and 5, determine whether the number...Ch. 2 - In Exercises 4 and 5, determine whether the number...Ch. 2 - Prob. 6CRCh. 2 - In Exercises 7 and 8, identify the population and...Ch. 2 - Prob. 8CRCh. 2 - In Exercises 9 and 10, determine whether the study...Ch. 2 - Section 1.3 In Exercises 9 and 10, determine...Ch. 2 - Prob. 11CRCh. 2 - Section 1.2 In Exercises 11 and 12, determine...Ch. 2 - The numbers of tornadoes by state in 2016 are...Ch. 2 - Prob. 14CRCh. 2 - Tail lengths (in feet) for a sample of American...Ch. 2 - A study shows that life expectancies for Americans...Ch. 2 - In Exercises 1719, use the data set, which...Ch. 2 - In Exercises 1719, use the data set, which...Ch. 2 - In Exercises 1719, use the data set, which...
Knowledge Booster


Learn more about
Need a deep-dive on the concept behind this application? Look no further. Learn more about this topic, statistics and related others by exploring similar questions and additional content below.Similar questions
- Hi, I need to make sure I have drafted a thorough analysis, so please answer the following questions. Based on the data in the attached image, develop a regression model to forecast the average sales of football magazines for each of the seven home games in the upcoming season (Year 10). That is, you should construct a single regression model and use it to estimate the average demand for the seven home games in Year 10. In addition to the variables provided, you may create new variables based on these variables or based on observations of your analysis. Be sure to provide a thorough analysis of your final model (residual diagnostics) and provide assessments of its accuracy. What insights are available based on your regression model?arrow_forwardI want to make sure that I included all possible variables and observations. There is a considerable amount of data in the images below, but not all of it may be useful for your purposes. Are there variables contained in the file that you would exclude from a forecast model to determine football magazine sales in Year 10? If so, why? Are there particular observations of football magazine sales from previous years that you would exclude from your forecasting model? If so, why?arrow_forwardStat questionsarrow_forward
- 1) and let Xt is stochastic process with WSS and Rxlt t+t) 1) E (X5) = \ 1 2 Show that E (X5 = X 3 = 2 (= = =) Since X is WSSEL 2 3) find E(X5+ X3)² 4) sind E(X5+X2) J=1 ***arrow_forwardProve that 1) | RxX (T) | << = (R₁ " + R$) 2) find Laplalse trans. of Normal dis: 3) Prove thy t /Rx (z) | < | Rx (0)\ 4) show that evary algebra is algebra or not.arrow_forwardFor each of the time series, construct a line chart of the data and identify the characteristics of the time series (that is, random, stationary, trend, seasonal, or cyclical). Month Number (Thousands)Dec 1991 65.60Jan 1992 71.60Feb 1992 78.80Mar 1992 111.60Apr 1992 107.60May 1992 115.20Jun 1992 117.80Jul 1992 106.20Aug 1992 109.90Sep 1992 106.00Oct 1992 111.80Nov 1992 84.50Dec 1992 78.60Jan 1993 70.50Feb 1993 74.60Mar 1993 95.50Apr 1993 117.80May 1993 120.90Jun 1993 128.50Jul 1993 115.30Aug 1993 121.80Sep 1993 118.50Oct 1993 123.30Nov 1993 102.30Dec 1993 98.70Jan 1994 76.20Feb 1994 83.50Mar 1994 134.30Apr 1994 137.60May 1994 148.80Jun 1994 136.40Jul 1994 127.80Aug 1994 139.80Sep 1994 130.10Oct 1994 130.60Nov 1994 113.40Dec 1994 98.50Jan 1995 84.50Feb 1995 81.60Mar 1995 103.80Apr 1995 116.90May 1995 130.50Jun 1995 123.40Jul 1995 129.10Aug 1995…arrow_forward
- For each of the time series, construct a line chart of the data and identify the characteristics of the time series (that is, random, stationary, trend, seasonal, or cyclical). Year Month Units1 Nov 42,1611 Dec 44,1862 Jan 42,2272 Feb 45,4222 Mar 54,0752 Apr 50,9262 May 53,5722 Jun 54,9202 Jul 54,4492 Aug 56,0792 Sep 52,1772 Oct 50,0872 Nov 48,5132 Dec 49,2783 Jan 48,1343 Feb 54,8873 Mar 61,0643 Apr 53,3503 May 59,4673 Jun 59,3703 Jul 55,0883 Aug 59,3493 Sep 54,4723 Oct 53,164arrow_forwardHigh Cholesterol: A group of eight individuals with high cholesterol levels were given a new drug that was designed to lower cholesterol levels. Cholesterol levels, in milligrams per deciliter, were measured before and after treatment for each individual, with the following results: Individual Before 1 2 3 4 5 6 7 8 237 282 278 297 243 228 298 269 After 200 208 178 212 174 201 189 185 Part: 0/2 Part 1 of 2 (a) Construct a 99.9% confidence interval for the mean reduction in cholesterol level. Let a represent the cholesterol level before treatment minus the cholesterol level after. Use tables to find the critical value and round the answers to at least one decimal place.arrow_forwardI worked out the answers for most of this, and provided the answers in the tables that follow. But for the total cost table, I need help working out the values for 10%, 11%, and 12%. A pharmaceutical company produces the drug NasaMist from four chemicals. Today, the company must produce 1000 pounds of the drug. The three active ingredients in NasaMist are A, B, and C. By weight, at least 8% of NasaMist must consist of A, at least 4% of B, and at least 2% of C. The cost per pound of each chemical and the amount of each active ingredient in one pound of each chemical are given in the data at the bottom. It is necessary that at least 100 pounds of chemical 2 and at least 450 pounds of chemical 3 be used. a. Determine the cheapest way of producing today’s batch of NasaMist. If needed, round your answers to one decimal digit. Production plan Weight (lbs) Chemical 1 257.1 Chemical 2 100 Chemical 3 450 Chemical 4 192.9 b. Use SolverTable to see how much the percentage of…arrow_forward
- At the beginning of year 1, you have $10,000. Investments A and B are available; their cash flows per dollars invested are shown in the table below. Assume that any money not invested in A or B earns interest at an annual rate of 2%. a. What is the maximized amount of cash on hand at the beginning of year 4.$ ___________ A B Time 0 -$1.00 $0.00 Time 1 $0.20 -$1.00 Time 2 $1.50 $0.00 Time 3 $0.00 $1.90arrow_forwardFor each of the time series, construct a line chart of the data and identify the characteristics of the time series (that is, random, stationary, trend, seasonal, or cyclical). Year Month Rate (%)2009 Mar 8.72009 Apr 9.02009 May 9.42009 Jun 9.52009 Jul 9.52009 Aug 9.62009 Sep 9.82009 Oct 10.02009 Nov 9.92009 Dec 9.92010 Jan 9.82010 Feb 9.82010 Mar 9.92010 Apr 9.92010 May 9.62010 Jun 9.42010 Jul 9.52010 Aug 9.52010 Sep 9.52010 Oct 9.52010 Nov 9.82010 Dec 9.32011 Jan 9.12011 Feb 9.02011 Mar 8.92011 Apr 9.02011 May 9.02011 Jun 9.12011 Jul 9.02011 Aug 9.02011 Sep 9.02011 Oct 8.92011 Nov 8.62011 Dec 8.52012 Jan 8.32012 Feb 8.32012 Mar 8.22012 Apr 8.12012 May 8.22012 Jun 8.22012 Jul 8.22012 Aug 8.12012 Sep 7.82012 Oct…arrow_forwardFor each of the time series, construct a line chart of the data and identify the characteristics of the time series (that is, random, stationary, trend, seasonal, or cyclical). Date IBM9/7/2010 $125.959/8/2010 $126.089/9/2010 $126.369/10/2010 $127.999/13/2010 $129.619/14/2010 $128.859/15/2010 $129.439/16/2010 $129.679/17/2010 $130.199/20/2010 $131.79 a. Construct a line chart of the closing stock prices data. Choose the correct chart below.arrow_forward
arrow_back_ios
SEE MORE QUESTIONS
arrow_forward_ios
Recommended textbooks for you

 Glencoe Algebra 1, Student Edition, 9780079039897...AlgebraISBN:9780079039897Author:CarterPublisher:McGraw Hill
 Mathematics For Machine TechnologyAdvanced MathISBN:9781337798310Author:Peterson, John.Publisher:Cengage Learning,
 Holt Mcdougal Larson Pre-algebra: Student Edition...AlgebraISBN:9780547587776Author:HOLT MCDOUGALPublisher:HOLT MCDOUGAL
 Algebra: Structure And Method, Book 1AlgebraISBN:9780395977224Author:Richard G. Brown, Mary P. Dolciani, Robert H. Sorgenfrey, William L. ColePublisher:McDougal Littell
 College AlgebraAlgebraISBN:9781305115545Author:James Stewart, Lothar Redlin, Saleem WatsonPublisher:Cengage Learning
Glencoe Algebra 1, Student Edition, 9780079039897...
Algebra
ISBN:9780079039897
Author:Carter
Publisher:McGraw Hill
Mathematics For Machine Technology
Advanced Math
ISBN:9781337798310
Author:Peterson, John.
Publisher:Cengage Learning,
Holt Mcdougal Larson Pre-algebra: Student Edition...
Algebra
ISBN:9780547587776
Author:HOLT MCDOUGAL
Publisher:HOLT MCDOUGAL
Algebra: Structure And Method, Book 1
Algebra
ISBN:9780395977224
Author:Richard G. Brown, Mary P. Dolciani, Robert H. Sorgenfrey, William L. Cole
Publisher:McDougal Littell
College Algebra
Algebra
ISBN:9781305115545
Author:James Stewart, Lothar Redlin, Saleem Watson
Publisher:Cengage Learning
Use of ALGEBRA in REAL LIFE; Author: Fast and Easy Maths !;https://www.youtube.com/watch?v=9_PbWFpvkDc;License: Standard YouTube License, CC-BY
Compound Interest Formula Explained, Investment, Monthly & Continuously, Word Problems, Algebra; Author: The Organic Chemistry Tutor;https://www.youtube.com/watch?v=P182Abv3fOk;License: Standard YouTube License, CC-BY
Applications of Algebra (Digit, Age, Work, Clock, Mixture and Rate Problems); Author: EngineerProf PH;https://www.youtube.com/watch?v=Y8aJ_wYCS2g;License: Standard YouTube License, CC-BY