ORGANIC CHEMISTRY-NEXTGEN+BOX (2 SEM.)
4th Edition
ISBN: 9781119761068
Author: Klein
Publisher: WILEY
expand_more
expand_more
format_list_bulleted
Concept explainers
Videos
Textbook Question
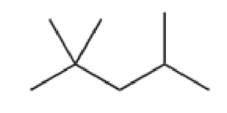
Chapter 2.3, Problem 2.3P
For each of the following compounds, determine whether or not you would expect its IR spectrum to exhibit a signal to the left of 3000 cm–1
Expert Solution & Answer
Want to see the full answer?
Check out a sample textbook solution
Students have asked these similar questions
Draw the following molecule: (Z)-1-chloro-1-butene
Identify the molecule as having a(n) E, Z, cis, or trans configuration.
CH3
H₁₂C
○ E
○ z
○ cis
trans
Identify the molecule as having a(n) E, Z, cis, or trans configuration.
H₂C-
CH3
О Е
○ cis
○ trans
Chapter 2 Solutions
ORGANIC CHEMISTRY-NEXTGEN+BOX (2 SEM.)
Ch. 2.3 - For each of the following compounds, determine...Ch. 2.3 - For each of the following compounds, determine...Ch. 2.3 - For each of the following compounds, determine...Ch. 2.3 - For each of the following compounds, determine...Ch. 2.3 - The following compound has three carbonyl groups....Ch. 2.4 - Predict which of the following C=C bonds will...Ch. 2.4 - The C=C bond in the following compound produces an...Ch. 2.5 - For each IR spectrum below, identify whether it is...Ch. 2.5 - For each IR spectrum below, identify whether it is...Ch. 2.5 - For each IR spectrum below, identify whether it is...
Ch. 2.5 - For each IR spectrum below, identify whether it is...Ch. 2.5 - For each IR spectrum below, identify whether it is...Ch. 2.5 - For each IR spectrum below, determine whether it...Ch. 2.5 - For each IR spectrum below, determine whether it...Ch. 2.5 - For each IR spectrum below, determine whether it...Ch. 2.5 - For each IR spectrum below, determine whether it...Ch. 2.5 - For each IR spectrum below, determine whether it...Ch. 2.5 - For each IR spectrum below, determine whether it...Ch. 2.5 - For each IR spectrum below, determine whether it...Ch. 2.6 - Prob. 2.22P
Additional Science Textbook Solutions
Find more solutions based on key concepts
Define histology.
Fundamentals of Anatomy & Physiology (11th Edition)
What type of cut would separate the brain into anterior and posterior parts?
Anatomy & Physiology (6th Edition)
Explain how the behavior of homologous chromosomes in meiosis parallels Mendels law of segregation for autosoma...
Genetic Analysis: An Integrated Approach (3rd Edition)
Practice Problem 7.23
Write the structure of compound A, used in this synthesis of the perfume ingredient (Z)-j...
Organic Chemistry
Explain all answers clearly, with complete sentences and proper essay structure if needed. An asterisk (*) desi...
Cosmic Perspective Fundamentals
1.3 Obtain a bottle of multivitamins and read the list of ingredients. What are four chemicals from the list?
Chemistry: An Introduction to General, Organic, and Biological Chemistry (13th Edition)
Knowledge Booster


Learn more about
Need a deep-dive on the concept behind this application? Look no further. Learn more about this topic, chemistry and related others by exploring similar questions and additional content below.Similar questions
- The decomposition of dinitrogen pentoxide according to the equation: 50°C 2 N2O5(g) 4 NO2(g) + O2(g) follows first-order kinetics with a rate constant of 0.0065 s-1. If the initial concentration of N2O5 is 0.275 M, determine: the final concentration of N2O5 after 180 seconds. ...arrow_forwardDon't used hand raitingarrow_forwardCS2(g) →CS(g) + S(g) The rate law is Rate = k[CS2] where k = 1.6 × 10⁻⁶ s−¹. S What is the concentration of CS2 after 5 hours if the initial concentration is 0.25 M?arrow_forward
- CS2(g) → CS(g) + S(g) The rate law is Rate = k [CS2] where k = 1.6 × 10⁻⁶ s−1. S Calculate the half-life.arrow_forwardThe following is a first order reaction where the rate constant, k, is 6.29 x 10⁻³ min-*** What is the half-life? C2H4 C2H2 + H2arrow_forwardControl Chart Drawing Assignment The table below provides the number of alignment errors observed during the final inspection of a certain model of airplane. Calculate the central, upper, and lower control limits for the c-chart and draw the chart precisely on the graph sheet provided (based on 3-sigma limits). Your chart should include a line for each of the control limits (UCL, CL, and LCL) and the points for each observation. Number the x-axis 1 through 25 and evenly space the numbering for the y-axis. Connect the points by drawing a line as well. Label each line drawn. Airplane Number Number of alignment errors 201 7 202 6 203 6 204 7 205 4 206 7 207 8 208 12 209 9 210 9 211 8 212 5 213 5 214 9 215 8 216 15 217 6 218 4 219 13 220 7 221 8 222 15 223 6 224 6 225 10arrow_forward
- Collagen is used to date artifacts. It has a rate constant = 1.20 x 10⁻⁴ /years. What is the half life of collagen?arrow_forwardיווי 10 20 30 40 50 60 70 3.5 3 2.5 2 1.5 1 [ppm] 3.5 3 2.5 2 1.5 1 6 [ppm] 1 1.5 -2.5 3.5arrow_forward2H2S(g)+3O2(g)→2SO2(g)+2H2O(g) A 1.2mol sample of H2S(g) is combined with excess O2(g), and the reaction goes to completion. Question Which of the following predicts the theoretical yield of SO2(g) from the reaction? Responses 1.2 g Answer A: 1.2 grams A 41 g Answer B: 41 grams B 77 g Answer C: 77 grams C 154 g Answer D: 154 grams Darrow_forward
- Part VII. Below are the 'HNMR, 13 C-NMR, COSY 2D- NMR, and HSQC 2D-NMR (similar with HETCOR but axes are reversed) spectra of an organic compound with molecular formula C6H1003 - Assign chemical shift values to the H and c atoms of the compound. Find the structure. Show complete solutions. Predicted 1H NMR Spectrum 4.7 4.6 4.5 4.4 4.3 4.2 4.1 4.0 3.9 3.8 3.7 3.6 3.5 3.4 3.3 3.2 3.1 3.0 2.9 2.8 2.7 2.6 2.5 2.4 2.3 2.2 2.1 2.0 1.9 1.8 1.7 1.6 1.5 1.4 1.3 1.2 1.1 f1 (ppm) Predicted 13C NMR Spectrum 100 f1 (ppm) 30 220 210 200 190 180 170 160 150 140 130 120 110 90 80 70 -26 60 50 40 46 30 20 115 10 1.0 0.9 0.8 0 -10arrow_forwardQ: Arrange BCC and Fec metals, in sequence from the Fable (Dr. R's slides) and Calculate Volume and Density. Aa BCC V 52 5 SFCCarrow_forwardNonearrow_forward
arrow_back_ios
SEE MORE QUESTIONS
arrow_forward_ios
Recommended textbooks for you
 Organic Chemistry: A Guided InquiryChemistryISBN:9780618974122Author:Andrei StraumanisPublisher:Cengage Learning
 EBK A SMALL SCALE APPROACH TO ORGANIC LChemistryISBN:9781305446021Author:LampmanPublisher:CENGAGE LEARNING - CONSIGNMENT
 Organic ChemistryChemistryISBN:9781305580350Author:William H. Brown, Brent L. Iverson, Eric Anslyn, Christopher S. FootePublisher:Cengage Learning
Organic Chemistry: A Guided Inquiry
Chemistry
ISBN:9780618974122
Author:Andrei Straumanis
Publisher:Cengage Learning
EBK A SMALL SCALE APPROACH TO ORGANIC L
Chemistry
ISBN:9781305446021
Author:Lampman
Publisher:CENGAGE LEARNING - CONSIGNMENT
Organic Chemistry
Chemistry
ISBN:9781305580350
Author:William H. Brown, Brent L. Iverson, Eric Anslyn, Christopher S. Foote
Publisher:Cengage Learning
NMR Spectroscopy; Author: Professor Dave Explains;https://www.youtube.com/watch?v=SBir5wUS3Bo;License: Standard YouTube License, CC-BY