
Concept explainers
Videos
To review:
The relationship between the number of synonymous substitutions and the years of divergence between each pair of species, with the help of a graph. Also, estimate the rates of synonymous substitutions per million years and per generation for the complete axon on a per-site basis.
Given:
In the given study, a hypothetical gene encodes for the transcription factor in various species of Drosophila. According to the diagram (Figure 1) given below, one exon of this gene is sequenced in four species.
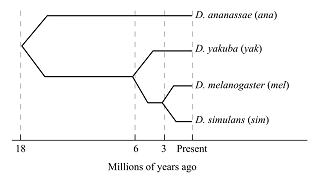
Figure 1: Million of years ago.
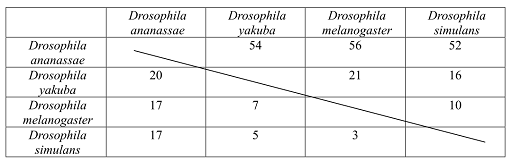
The matrix shows the number of synonymous and nonsynonymous substitutions between pairs of different Drosophila species, which evolved as a result of evolution. There are 2,000 nonsynonymous and 600 synonymous substitutions sites of the exon (Figure 2).
Figure 2: Matrix showing the number of synonymous and nonsynonymous substitutions between pairs of species of Drosophila.
Introduction:
Biologists are able to make inference about the type of natural selection, by the study based on molecular evolutionary patterns of genes. These inferences are important to know, about the gene functioning and how they evolve over the time, in response to the new function and conditions.
Explanation of Solution
According to the given analysis, there are, on an average, 54 synonymous substitutions occurs between the lineages. These lineages were diverged 18 million years ago. So, there are about 1.5 synonymous substitutions per million year for the entire exon.
Therefore, the information used for calculation of the rate is:
Time period: 18 million years ago
Substitution per million years: 1.5
Lineages: 2
Generation per year: 5
Synonymous sites: 600
Thus, for rate of substitution per generation is:
90,000,000 years
Similarly, the rate of substitution per site is:
(90,000,000 years
Graph given below shows number of substitution along with millions of years.
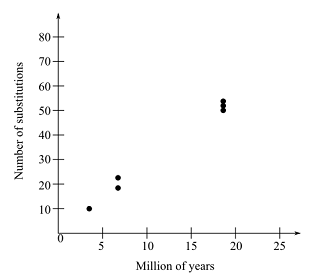
Therefore, it can be concluded that the rates are 3
Want to see more full solutions like this?
Chapter 23 Solutions
Life: The Science of Biology


- Describe and give a specific example of how successionary stage is related to species diversity?arrow_forwardExplain down bellow what happens to the cell in pictures not in words: Decreased pH in mitochondria Increased ATP Decreased pH in cytosol Increased hydrolysis Decreasing glycogen and triglycerides Increased MAP kinase activity Poor ion transport → For each one:→ What normally happens?→ What is wrong now?→ How does it mess up the cell?arrow_forward1.) Community Diversity: The brown and orange line represent two different plant communities. a. Which color represents the community with a higher species richness? b. Which color represents the community with a higher species evenness? Relative abundance 0.1 0.04 0.001 2 4 6 8 10 12 14 16 18 20 22 24 Rank abundance c. What is the maximum value of the Simpson's diversity index (remember, Simpson's index is D = p², Simpson's diversity index is 1-D)? d. If the Simpson's diversity index equals 1, what does that mean about the number of species and their relative abundance within community being assessed?arrow_forward
- 1.) Community Diversity: The brown and orange line represent two different plant communities. a. Which color represents the community with a higher species richness? b. Which color represents the community with a higher species evenness? Relative abundance 0.1 0.04 0.001 2 4 6 8 10 12 14 16 18 20 22 24 Rank abundance c. What is the maximum value of the Simpson's diversity index (remember, Simpson's index is D = p², Simpson's diversity index is 1-D)? d. If the Simpson's diversity index equals 1, what does that mean about the number of species and their relative abundance within community being assessed?arrow_forwardwhat measures can a mother to take to improve the produce of her to milk to her newborn baby ?arrow_forward1. Color the line that represents all ancestors of the Eastern white pine tree green (but only the ancestral line NOT shared with other organisms) 2. Oncle the last common ancestor of the Colorado blue spruce tree and Eastern white pine tree. 3. Put a box around the last common ancestor of the sugar maple tree and the dogwood tree. 4. Put a triangle around the last common ancestor of the red pine tree and the american holly bush. 5. Color the line that represents all ancestors of the Ponderosa pine tree red (including all shared ancestors). 6. Color the line that represents all ancestors of the American elm tree blue (including all shared ancestors). 7 Color the line that represents all ancestors of the Sabal palm tree purple (including all shared ancestors) 8. Using a yellow highlighter or colored pencil, circle the clade that includes all pine trees. 9. Using a orange highlighter or colored pencil, circle the clade that includes all gymnosperms 10. Can you tell…arrow_forward
- You have been hired as a public relations specialist to give invertebrates a good name. After all, they are much more than just creepy crawly bugs! Your first task though is to convince yourself that is true. The best way to do that is to start close to home. Find something in your house that is a product obtained directly from an invertebrate or only due to an invertebrate’s actions. Describe the product, its function and utility, as well as any human manufactured alternatives. Be sure to highlight the advantages of obtaining this directly from nature. Keep in mind, a product can be something you use, wear, eat, or enjoy for its visual appeal.arrow_forwardUse the following tree diagram to answer Questions #8-10. 8) Which of the following two animals are the most closely related based on the tree to the left? a) Pig and camel b) Hippo and pig c) Deer and cow 9) CIRCLE on the tree diagram where the common ancestor between a hippo and a cow is. 10) Put a SQUARE on the tree diagram where the common ancestor between a pig and a peccary is.arrow_forwardExplain: Healthy Cell Function Overview→ Briefly describe how a healthy cell usually works: metabolism (ATP production), pH balance, glycogen storage, ion transport, enzymes, etc. Gene Mutation and Genetics Part→ Focus on the autosomal recessive mutation and explain: How gene mutation affects the cell. How autosomal inheritance works. Compare the normal and mutated gene sequences simply. → Talk about possible consequences of a faulty hydrolytic enzyme.arrow_forward
- Can you fill out those termsarrow_forwardExplain down bellow what happens to the cell: Decreased pH in mitochondria Increased ATP Decreased pH in cytosol Increased hydrolysis Decreasing glycogen and triglycerides Increased MAP kinase activity Poor ion transport → For each one:→ What normally happens?→ What is wrong now?→ How does it mess up the cell?arrow_forwardAn 1100 pound equine patient was given 20 mg/kg sucralfate 3 times a day, 2.8 mg/kg famotidine twice a day, and 10mg/kg doxycycline twice a day. Sucralfate comes as a 1 gm tablet, famotidine as 20 mg tablets, and doxycycline as 100mg tablets. All are in bottles of 100 tablets.How many total mg are needed for the patient and how many tablets of each would be needed to provide each dose?How many bottles of each would be needed to have available if this patient were to be on this drug regimen for 5 days?arrow_forward
 Biology: The Dynamic Science (MindTap Course List)BiologyISBN:9781305389892Author:Peter J. Russell, Paul E. Hertz, Beverly McMillanPublisher:Cengage Learning
 Human Biology (MindTap Course List)BiologyISBN:9781305112100Author:Cecie Starr, Beverly McMillanPublisher:Cengage Learning
 Human Heredity: Principles and Issues (MindTap Co...BiologyISBN:9781305251052Author:Michael CummingsPublisher:Cengage Learning
 Biology (MindTap Course List)BiologyISBN:9781337392938Author:Eldra Solomon, Charles Martin, Diana W. Martin, Linda R. BergPublisher:Cengage Learning
 Biology: The Unity and Diversity of Life (MindTap...BiologyISBN:9781337408332Author:Cecie Starr, Ralph Taggart, Christine Evers, Lisa StarrPublisher:Cengage Learning
 Biology 2eBiologyISBN:9781947172517Author:Matthew Douglas, Jung Choi, Mary Ann ClarkPublisher:OpenStax